
| Library | Status | Version | License | OS | Compiler |
|---|---|---|---|---|---|
| nimdataframe | Development | 0.0.5.x | MIT opensource | Linux | Nim >= 0.19.x |
Attempt of using csv data from the net, locally or generated to implement display,handling,sorting and data extraction.
Work in progress
used with https://github.com/qqtop/NimFinLib
        nimble install nimcx
        nimble install https://github.com/qqtop/nimdataframe.git
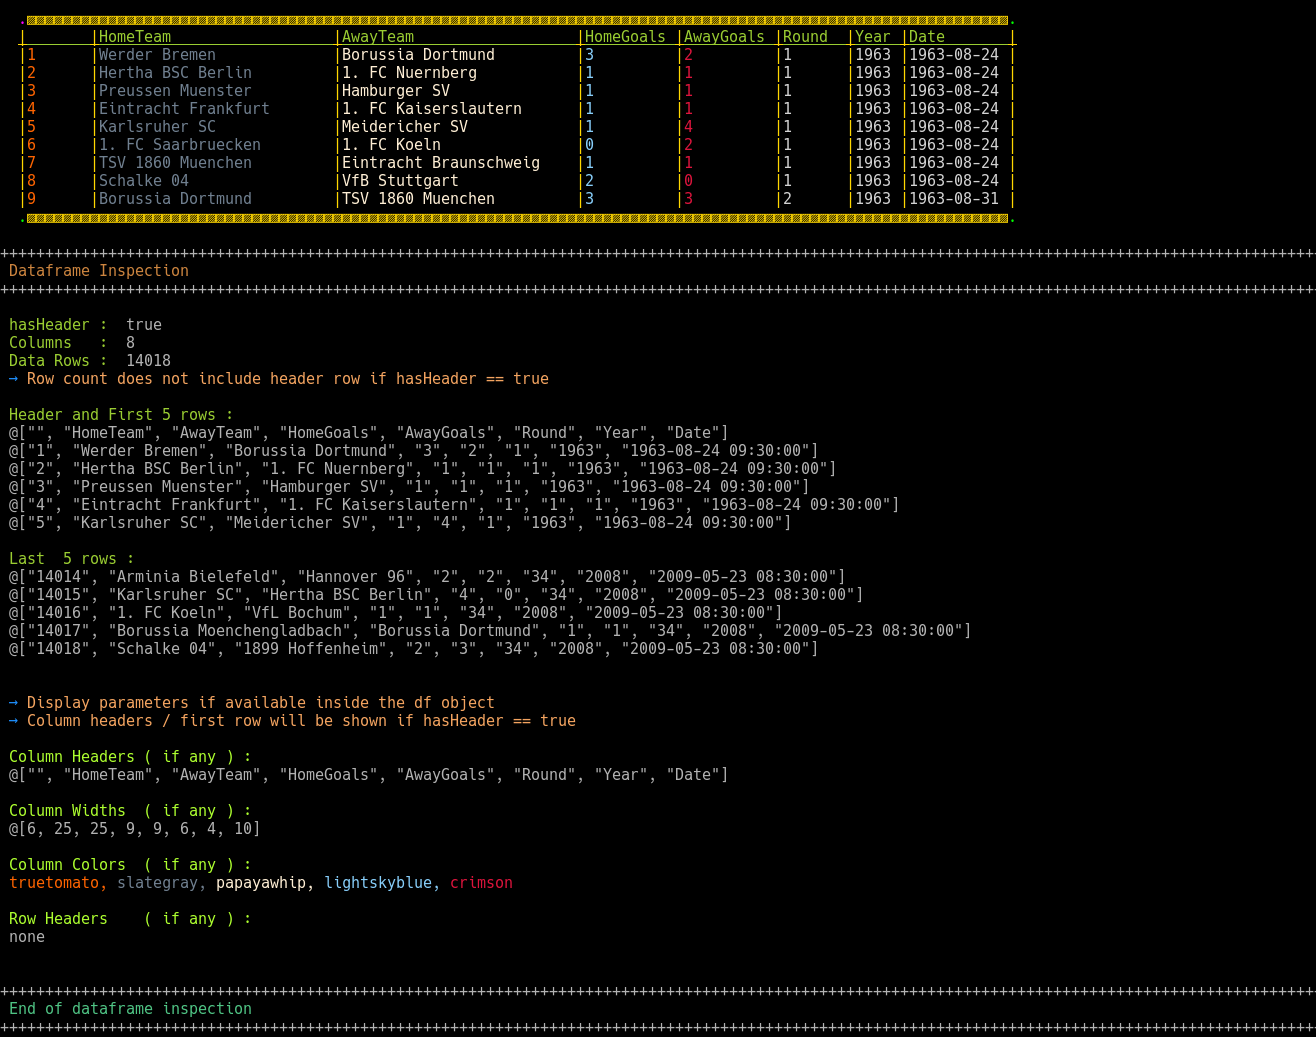
Screenshot of nimdfT19 showing bluenote10 / bundesliga.csv with nimdataframe
Example Code
## nimdfT13.nim
##
##
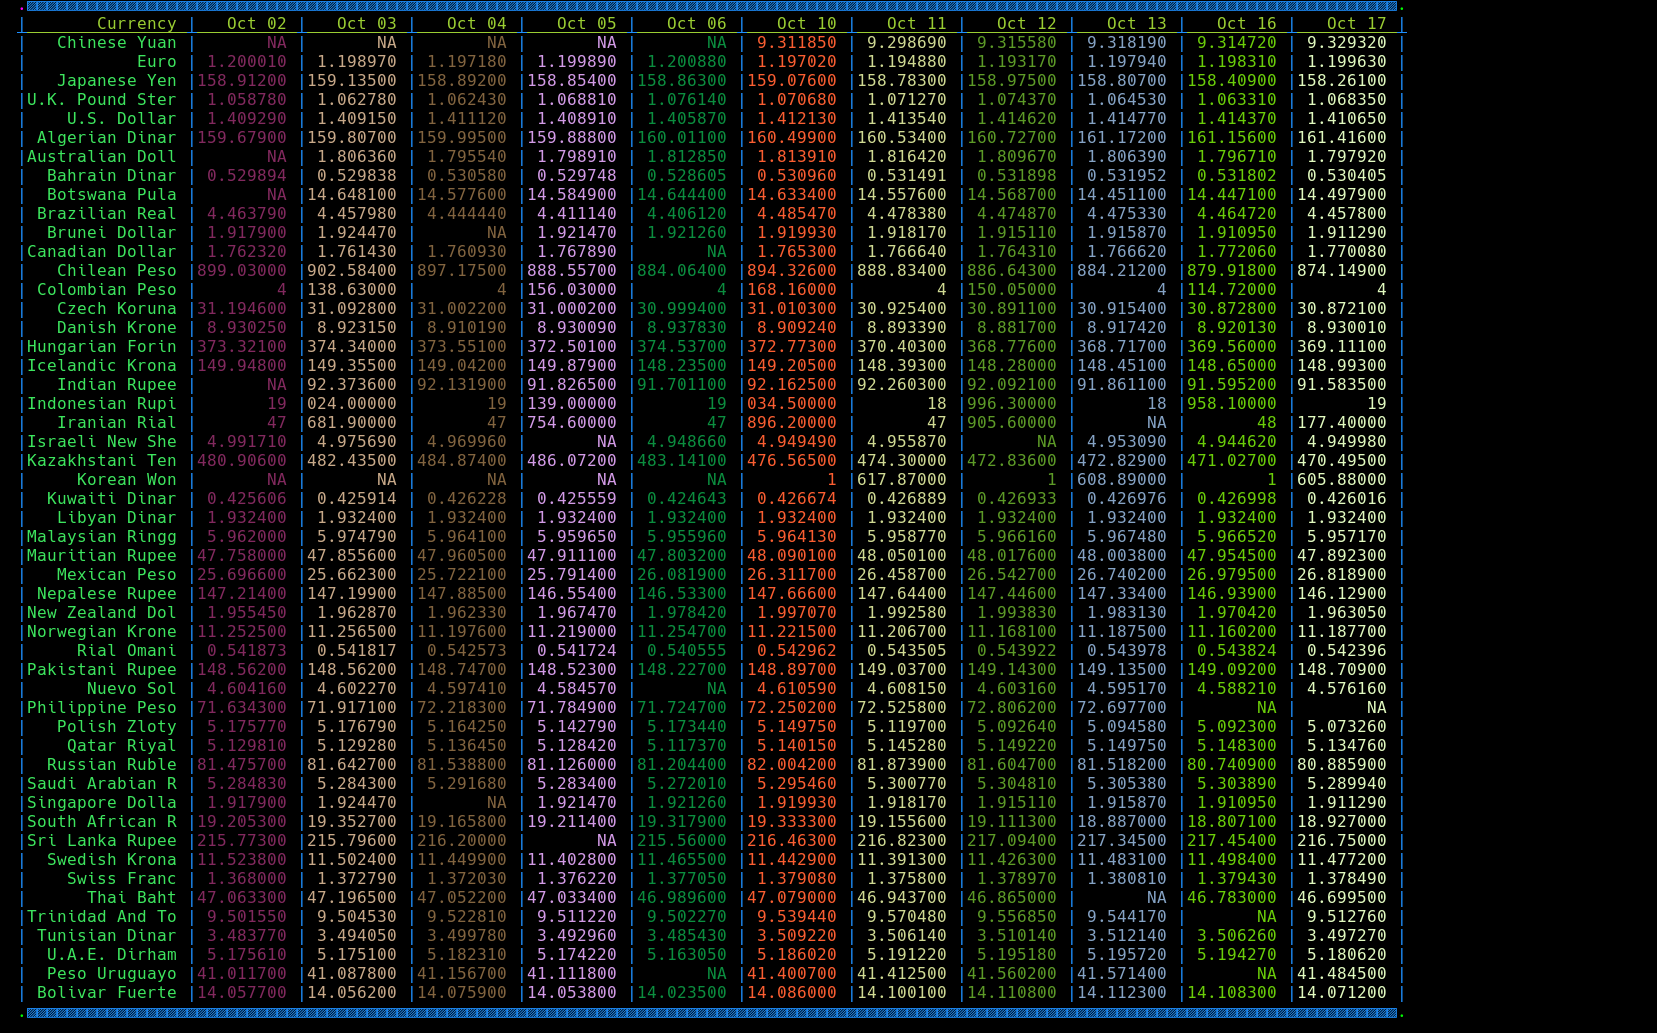
# October data from http://www.imf.org/external/np/fin/data/rms_mth.aspx?reportType=CVSDR
# slightly processed to shorten header (only data of first table imported here) and saved into file rms.csv
import nimcx , nimdataframe
let ufo = "rms.csv"
var ndf9 = createDataFrame(ufo,cols = 12,sep = ',',hasHeader = true) # load locally from rms.csv also give state the number of cols in csv
if ndf9.hasHeader == true:
for x in 0..<ndf9.colcount: ndf9.colheaders.add(ndf9.df[0][x]) # row 0 col x
for x in 0..<ndf9.colcount: ndf9.colcolors.add(randcol()) # create some fun colors and add to df
for x in 0..<ndf9.colcount: ndf9.colwidths.add(9) # create a colwidths for each column default here is 9
ndf9.colwidths[0] = 15 # change first column width to 15
printLnBiCol("Data Source : " & ufo,xpos = 3)
echo()
showDf(ndf9, # display df
rows = 1500,
cols = toNimis(toSeq(1 .. ndf9.colCount)),
colwd = ndf9.colwidths,
colcolors = ndf9.colcolors,
showFrame = true,
framecolor = dodgerblue,
showHeader = true,
xpos = 3)
decho(3)
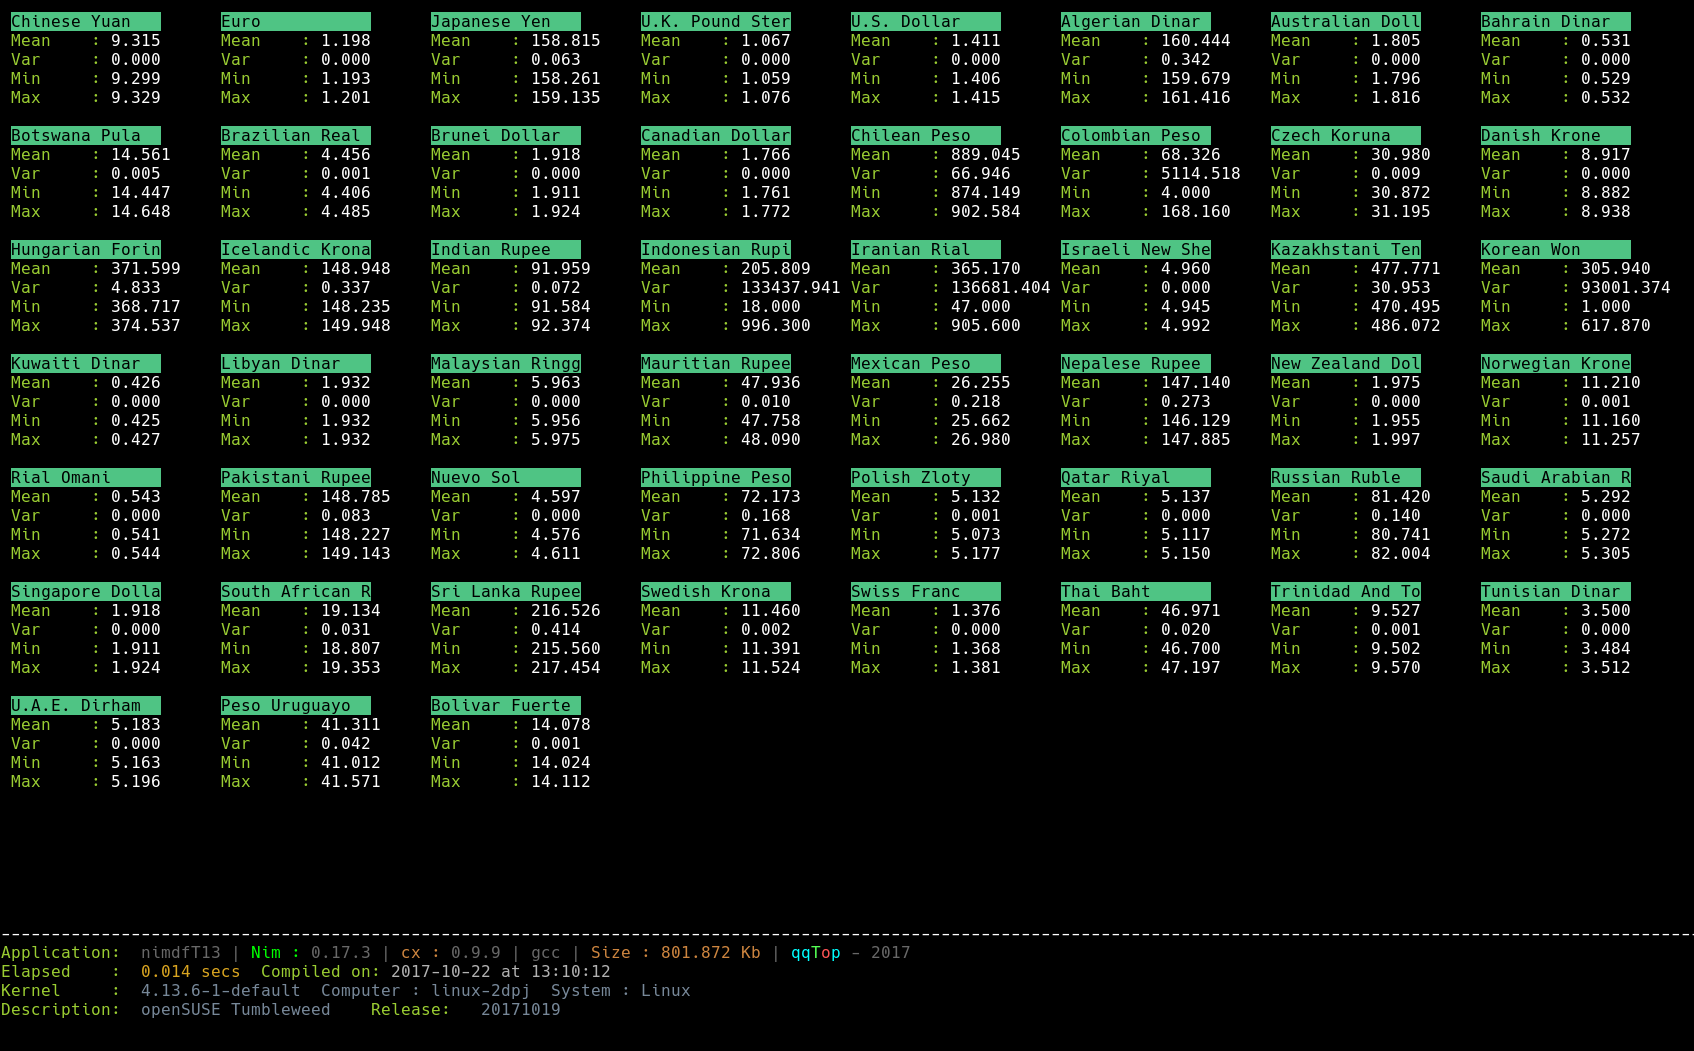
# now we want to display row statistics on this df
var xpos = 2
var startrow = 0
if ndf9.hasHeader == true : # donot read to run stats on the header
startrow = 1
else : startrow = 0
decho(2)
for row in startrow ..< ndf9.rowcount:
printLn(fmtx(["<20"],$(ndf9.df[row][0])),zippi,styled={stylereverse},xpos = xpos)
var x = dfRowStats(ndf9,row) # x now contains a runningstats instance for one row
# display stats for all rows
let n = 3 # decimals
cxprintLn(xpos,yellowgreen," " ,white, "") # need this blank line or display is jumbled up
cxprintLn(xpos,yellowgreen,"mean : " ,white, ff(x.mean,n))
cxprintln(xpos,yellowgreen,"var : " ,white, ff(x.variance,n))
cxprintln(xpos,yellowgreen,"min : " ,white, ff(x.min,n))
cxprintln(xpos,yellowgreen,"max : " ,white, ff(x.max,n))
curup(6)
xpos += 21
if xpos > tw - 30:
curdn(13)
xpos = 2
echo()
decho(6)
showDataframeInfo(ndf9,2)
doFinish()
Example screenshots of nimdfT13
NOTE :
 Improvements may be made at any time and without advance warning.
 Examples may break occasionally  ...  !

 Forking , testing,suggestions , ideas are welcome.
 This is development code hence use at your own risk.