A webapp to visualize your DynamoDB tables and table data, with a focus on cost optimization.
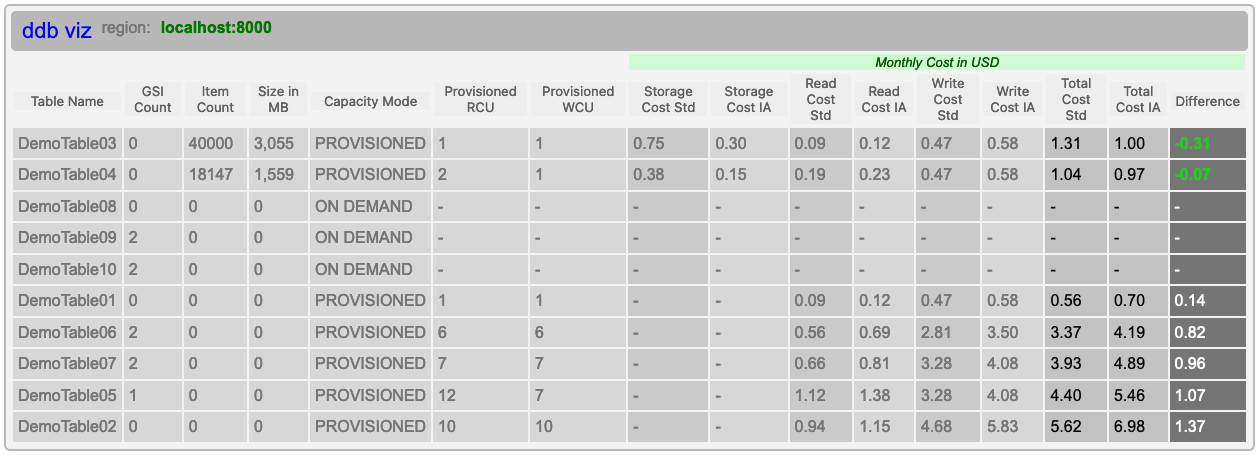
This tool allows you to click to an AWS region and see a smart grid of all your DynamoDB tables. Table sizes, configuration settings, and costs are shown in sortable columns, allowing you to spot the tables with the biggest costs.
You can click on a table name to open a panel with your table's GSI list, a scan button, and a query form. Scan to show your items' attributes styled and organized in schemaless mode, grid mode, or summarized. Hover over each GSI name and the item grid reacts by illuminating the GSI's sparcity and projection. Select the GSI and scan again to see the GSI's collections. Partition and sort key values are clickable.
Color legend:
Partition Key Sort Key
GSI Partition Key GSI Sort Key
- An AWS account with DynamoDB tables
- AWS CLI setup and configured with DynamoDB permissions
- Node.JS with the
aws-sdkv3 installed - Remix.run installed
You can run this webapp on your laptop or in the AWS Cloud9 environment.
-
Clone the repository to your laptop
-
Open a shell terminal. Verify your environment is ready to connect to your AWS account by running
aws sts get-caller-identityandaws dynamodb list-tables -
Navigate into the app folder, and type
npm installand thennpm run postinstallto install remix and required node modules. -
Run
npm run devℹ️ Profiles and Ports The default AWS profile will be used unless you set this environment variable: export AWS_PROFILE=myprofileCloud9 users may set port 8080 so the Preview browser works: PORT=8080 npm run dev -
Navigate to http://localhost:3000 to open the app.
-
Choose one of the regions listed, or you can choose localhost:8000 to use DynamoDB Local.
-
A grid with rows and columns should appear. Notice the column headers are sortable.
-
Review the final columns which calculate and compare the monthly table costs in Standard and Infrequent Access (IA) modes.
-
If a table may benefit from IA, the monthly savings will be shown in green.
The regions available for navigation may be manually adjusted in the app/configuration.js file.
While the app neither stores or requires AWS credentials to run, relying only on your existing CLI environment, it does expose DynamoDB's list-tables via HTTP. It is recommended to stop the dev server when you are done.
Submit a PR or an Issue, or share your feedback.