script.module.web-pdb is a port of my Web-PDB Python package modified for using in Kodi mediacenter.
It is a web-interface for Python's built-in PDB debugger that can be used for remote debugging of
Python addons in vivo, that is, while running inside Kodi.
Except for modifications needed to run inside Kodi, all other Web-PDB/PDB functionality is left intact
so you can use all available documentation and tutorials for the PDB debugger
to learn how to debug your Python code.
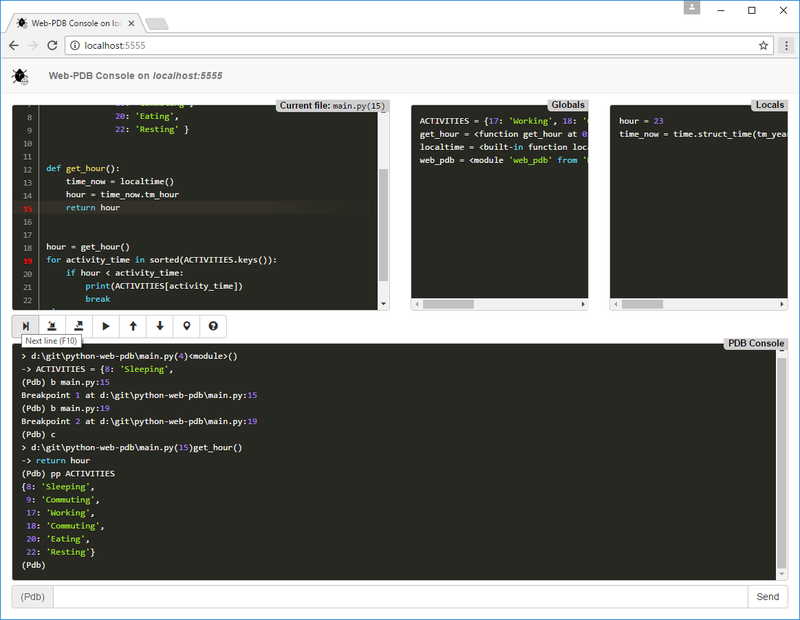
Web-PDB console in Chrome browser
First you need to install script.module.web-pdb addon in your Kodi instance where you want to debug your addon.
The addon can be installed from the Kodi official addon repository:
Kodi Add-on repository > Program add-ons > Web-PDB.
Also an installable ZIP can be downloaded from Releases tab of this repository.
Then include script.module.web-pdb in your addon.xml as a dependency:
<requires>
  ...
  <import addon="script.module.web-pdb" />
</requires>
Restart Kodi so that it re-reads addon dependencies.
Insert the following line into your addon code at the point where you want to start debugging:
import web_pdb; web_pdb.set_trace()The set_trace() call will suspend your addon and open a web-UI at the default port 5555
(port value can be changed). At the same time a notification will be displayed in Kodi,
indicating that a debug session is active. The notification also shows web-UI host/port.
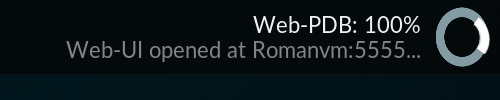
Notification in Kodi about an active Web-PDB debugging session
Enter in your the address bar of your browser: http://<your Kodi machine hostname or IP>:5555,
for example http://monty-python:5555. Use 127.0.0.1 or localhost as hostname
if you are connecting from the same machine that runs Kodi.
If everything is OK, you should see the Web-PDB UI like on the preceding screenshot.
Now you can use all PDB commands and features. Additional Current file, Globals and Locals
information boxes help you better track your program runtime state.
Multiple set_trace() calls can be used as hardcoded breakpoints.
Note: it is strongly recommended to work with the Web-PDB web-UI only in one browser session. With more than one browser window accessing the web-UI it can display incorrect data in one or more browser sessions.
Additionally, Web-PDB provides catch_post_mortem context manager that can catch
unhandled exceptions raised within its scope and automatically start PDB post-mortem debugging session.
For example:
import web_pdb

with web_pdb.catch_post_mortem():
    # Some error-prone code
    raise RuntimeError('Oops!')
For more detailed info about the Web-PDB API read docstrings in the /libs/web_pdb/__init__.py file.
Introductory video (courtesy of Michele Lombardo): https://www.youtube.com/watch?v=6gMmeA7UY18
My video tutorial for debugging Python addons for Kodi with Web-PDB: https://youtu.be/OukjNpafNZU
Note: Non-bundled front-end JavaScript/CSS source code is available in the
frontend directory.
MIT license, see LICENSE.txt.
The debugger icon made by Freepik from www.flaticon.com is licensed by CC 3.0 BY.