The idea of this hands on is to install a python application on a K8S cluster using the technologies most consumed by the market at the time of construction.
Terraform, Helm, Kubernetes, Grafana, Prometheus, Kibana, Elasticsearch, Dapr, Jaeger, Docker, Fluentd, Python, Ingress, Certmanager
Every feature will be deployed via terraform
- Install GKE (Google Kubernetes Enginee) cluster
- It will contain 1 node pool with 3 nodes southamerica-east1-a
- It contains a helm provider that will be responsible to install the apps in cluster
- A python application to test the monitoring/logging part
- Two python applications(backend/frontend) to test the observability part
Before starting you should have the following commands installed:
First, you should export variables you are going to use
export GOOGLE_PROJECT="<YOUR-PROJECT-NAME>" USE_GKE_GCLOUD_AUTH_PLUGIN="True" KUBE_CONFIG_PATH="~/.kube/config"
Authenticate into Google Cloud console, to so run the following command:
make terraform-login project_name=<YOUR-PROJECT-NAME>
Check your project to make sure everything goes well
make terraform-validation
Now, we will continue with the creation of the cluster/pools
make terraform-apply-cluster cluster_name=<YOUR-CLUSTER-NAME>
After a few minutes, your infra is ready to be used. It will show you everything that will be created by terraform, take a moment to check this output. Once you are ready, you just need to run:
make terraform-apply-pkgs cluster_name=<YOUR-CLUSTER-NAME> project_name=<YOUR-PROJECT-NAME>
It's possible to simplify the installation with make using the following command:
make all cluster_name=<YOUR-CLUSTER-NAME> project_name=<YOUR-PROJECT-NAME>
It will apply your changes in sequence. Once everything was applied, you will get an output similar to this,
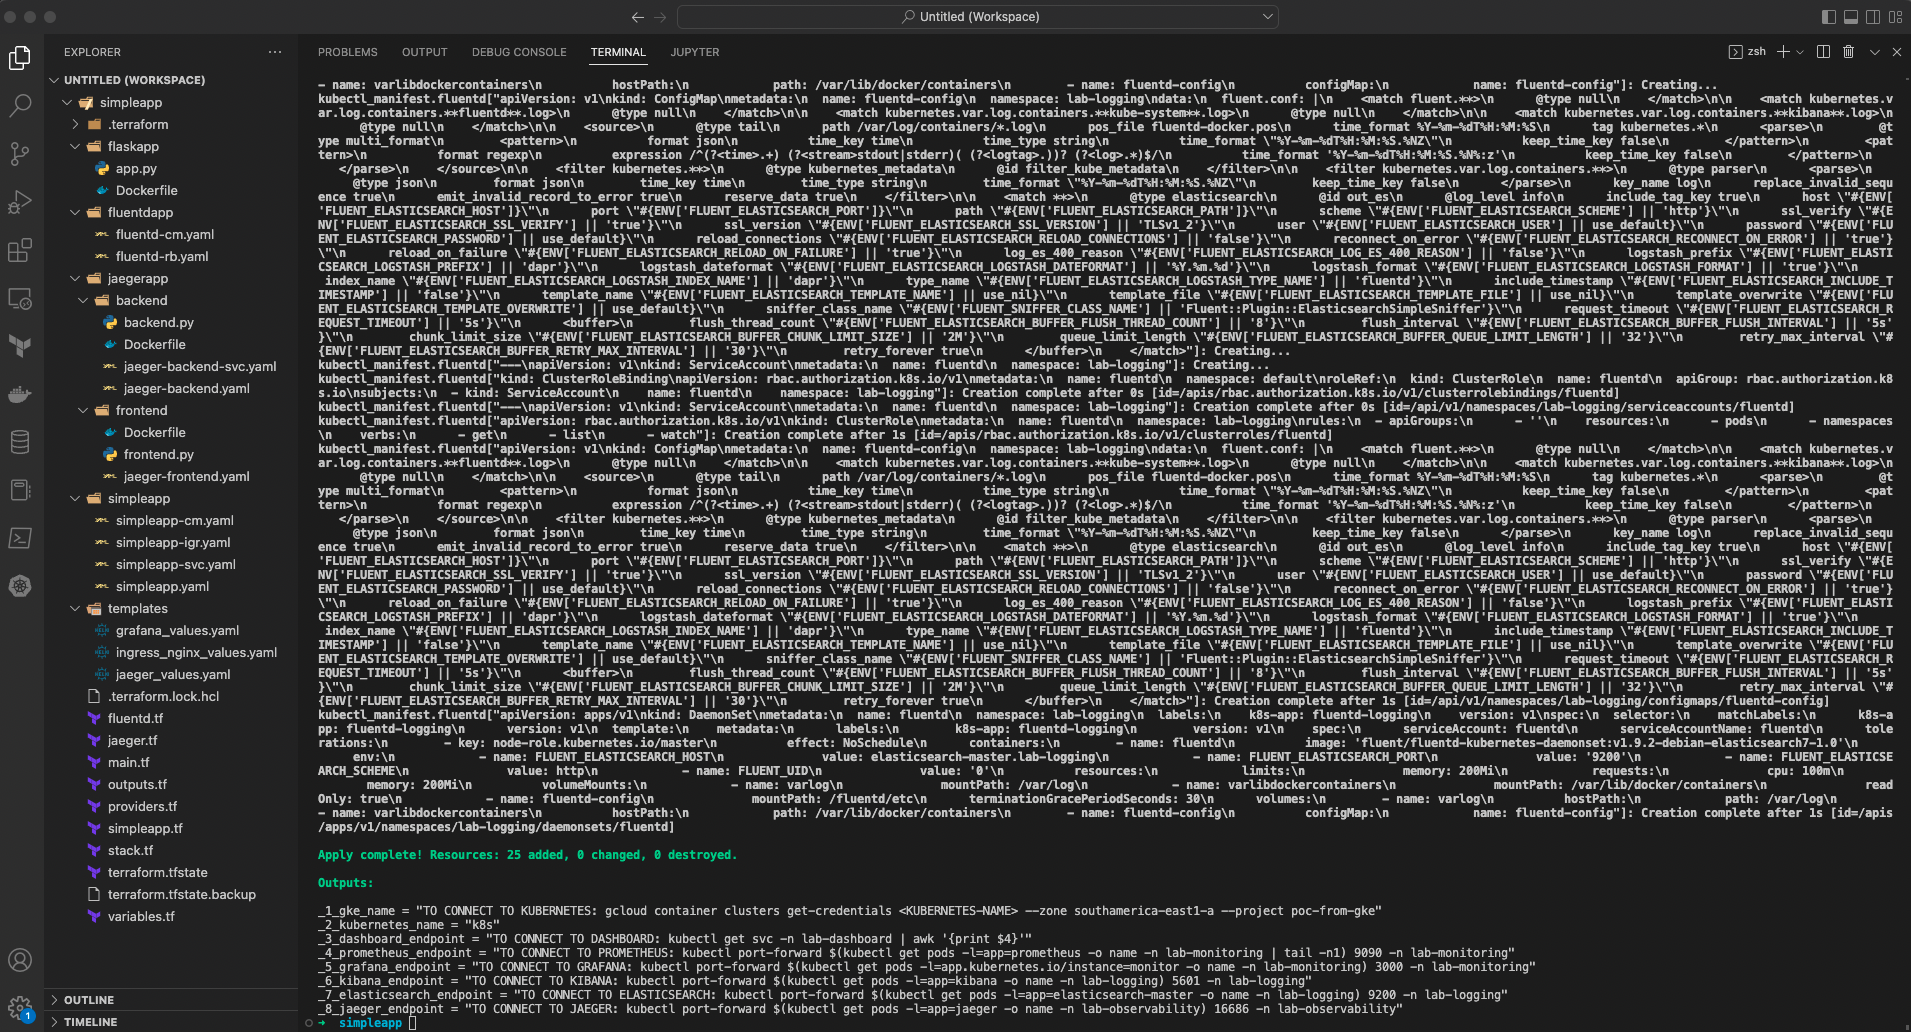
Once you port-foward your services, you can easily access it on your browser via localhost.
$ kubectl get svc -n lab-dashboard | awk '{print $4}'
$ kubectl get svc -n lab-app | awk '{print $4}' | head -n2
$ kubectl port-forward $(kubectl get pods -l=app="kibana" -o name -n lab-logging) 5601 -n lab-logging
$ kubectl port-forward $(kubectl get pods -l=app.kubernetes.io/instance="monitor" -o name -n lab-monitoring) 3000 -n lab-monitoring
$ kubectl port-forward $(kubectl get pods -l=app="prometheus" -o name -n lab-monitoring | tail -n1) 9090 -n lab-monitoring
$ kubectl port-forward $(kubectl get pods -l=app="elasticsearch-master" -o name -n lab-logging) 9200 -n lab-logging
$ kubectl port-forward $(kubectl get pods -l=app="jaeger" -o name -n lab-observability) 16686 -n lab-observability
$ kubectl port-forward $(kubectl get pods -l=app="frontend" -o name -n lab-observability) 8000 -n lab-observability
kubectl get secret --namespace lab-monitoring grafana -o jsonpath="{.data.admin-user}" | base64 --decode | xargs echo
kubectl get secret --namespace lab-monitoring grafana -o jsonpath="{.data.admin-password}" | base64 --decode | xargs echo
To facilitate the understanding of the logs, the following tags were used to view the logs
- kubernetes.container_name
- kubernetes.pod_name
- kubernetes.namespace_name
- log
Now, to clean up everything you just need to run
make terraform-destroy cluster_name=<YOUR-CLUSTER-NAME>
That's all folks!!!