LinkyPy k3s is an all-in-one installer of my LinkyPy Python project, plus InfluxDB and Grafana for your RaspberryPi.
It uses Kubernetes (k3s/rancher lighter version) to deploy everything needed.
-
A RaspberryPi, of course. A freshly installed Raspbian Lite is enough (with Wifi access and SSH activated).
-
A Linky energy meter with Teleinfo pins.

- A µTeleInfo dongle. It is plugged in the RaspberryPi through USB port and connected to the Teleinfo Linky pins. The USB dongle is available on Tindie.
/i/5857/products/2018-06-08T13%3A23%3A25.397Z-MicroTeleinfo_Top_V2.png)
k3sup will help you remotely install k3s to your RaspberryPi while arkade will help you deploy applications to k3s.
⚠️ This should be installed ON YOUR COMPUTER, not on the RaspberryPi.
Following the documentation:
# Install k3sup
curl -sLS https://get.k3sup.dev | sh
sudo install k3sup /usr/local/bin/

# Install arkade
curl -sLS https://dl.get-arkade.dev | sudo sh
You can check that everything is correctly installed with the following:
k3sup version _ _____
| | _|___ / ___ _ _ _ __
| |/ / |_ \/ __| | | | '_ \
| < ___) \__ \ |_| | |_) |
|_|\_\____/|___/\__,_| .__/
|_|
Version: 0.9.11
Git Commit: 79720da83b694735d6415f3f3d01f02a1f809da8
arkade version _ _
__ _ _ __| | ____ _ __| | ___
/ _` | '__| |/ / _` |/ _` |/ _ \
| (_| | | | < (_| | (_| | __/
\__,_|_| |_|\_\__,_|\__,_|\___|
Get Kubernetes apps the easy way
Version: 0.6.22
Git Commit: 690117d081d1ed750295361f1f54b8161d80adc2
This also should install kubectlthat we will use later to install the stack:
kubectl versionClient Version: version.Info{Major:"1", Minor:"17", GitVersion:"v1.17.2", GitCommit:"59603c6e503c87169aea6106f57b9f242f64df89", GitTreeState:"clean", BuildDate:"2020-01-18T23:30:10Z", GoVersion:"go1.13.5", Compiler:"gc", Platform:"darwin/amd64"}
Server Version: version.Info{Major:"1", Minor:"18", GitVersion:"v1.18.12+k3s1", GitCommit:"56cd36302dc3188f21f9877d1309df7d80cd8b7d", GitTreeState:"clean", BuildDate:"2020-11-13T06:12:33Z", GoVersion:"go1.13.15", Compiler:"gc", Platform:"linux/arm"}Jump to the scripts directory.
cd scriptsEdit the config.sh file to set the RaspberryPi IP address to use and also the hostname to be set.
vi config.shK3S_NODES=('192.168.1.200')
K3S_NAMES=('linky')Once set, save your file and you're now ready to launch the ìnstall.sh script.
./install.sh###############################################################################
WARNING
###############################################################################
This will install k3s on 192.168.1.200 !!!
Press any key to continue or Ctrl-C to exit
(...)Once installed, you should see your RaspberryPi as a Kubernetes node:
kubectl get nodes -o wideNAME STATUS ROLES AGE VERSION INTERNAL-IP EXTERNAL-IP OS-IMAGE KERNEL-VERSION CONTAINER-RUNTIME
linky Ready master 2m v1.18.12+k3s1 192.168.1.200 <none> Raspbian GNU/Linux 10 (buster) 5.4.72-v7l+ containerd://1.3.3-k3s2Back to the source directory:
cd ..Use kustomization.yaml to configure your settings.
In this file you can:
- Configure Grafana admin username and password in case you want to login as an administrator to customize the dashboard. Please note that anonymous users can still view the Linky dashboard (but can't change anything). Change
GF_SECURITY_ADMIN_USERandGF_SECURITY_ADMIN_PASSWORDvalues to reflect your needs. - Configure the backup/restore path and authentication using CIFS mount. In my installation I use an Apple TimeCapsule to store (daily) InfluxDB backups. Change
CIFS_PATH,CIFS_USERNAMEandCIFS_PASSWORDto reflect your needs. If you don't want to use this backup/restore procedure, you can comment out both jobs at the top of the file.
Edit the file with:
vi kustomization.yamlFind the secretGenerator section to change values:
(...)
secretGenerator:

  ###############################################################################
  # Grafana secrets.
  # Sets the Grafana login/password in case you want to change things in Grafana.
  # Please note that anonymous viewer can still view the Linky dashboard out of the box (but can't change anything).
  ###############################################################################
  - name: grafana-secrets
    behavior: replace
    literals:
      - GF_SECURITY_ADMIN_USER=admin
      - GF_SECURITY_ADMIN_PASSWORD=password

  ###############################################################################
  # InfluxDB backup/restore secrets.
  # If you don't want to use this backup (CIFS mount), please comment out both InfluxDB jobs above (backup and restore).
  # In my use case, I use an Apple TimeCapsule to store backups.
  ###############################################################################
  - name: influxdb-backup-restore-secrets
    behavior: replace
    literals:
      - CIFS_PATH=//192.168.1.100/Data/Linky_backups
      - CIFS_USERNAME=username
      - CIFS_PASSWORD=password
Save the file and you are ready to go for the next step.
You can now launch the installation with:
kubectl apply -k .configmap/grafana-dashboards-config created
configmap/grafana-datasources-config created
configmap/grafana-linky-dashboard-9dhtt2tc44 created
configmap/influxdb-config created
secret/grafana-secrets created
secret/influxdb-backup-restore-secrets created
service/grafana created
service/influxdb created
deployment.apps/grafana created
deployment.apps/influxdb created
deployment.apps/linkypy created
cronjob.batch/influxdb-backup created
cronjob.batch/influxdb-restore created
ingress.extensions/grafana-ingress createdCheck installation with kubectl:
kubectl get pods -o wideNAME READY STATUS RESTARTS AGE IP NODE NOMINATED NODE READINESS GATES
grafana-85969c855f-gcw98 1/1 Running 0 60s 10.42.0.64 rpi4-linky <none> <none>
influxdb-d6d9fcb9c-tv5g2 1/1 Running 0 60s 10.42.0.65 rpi4-linky <none> <none>
linkypy-6775c7bfbf-vb98h 1/1 Running 0 59s 10.42.0.66 rpi4-linky <none> <none>If everything is Running, you are done !!
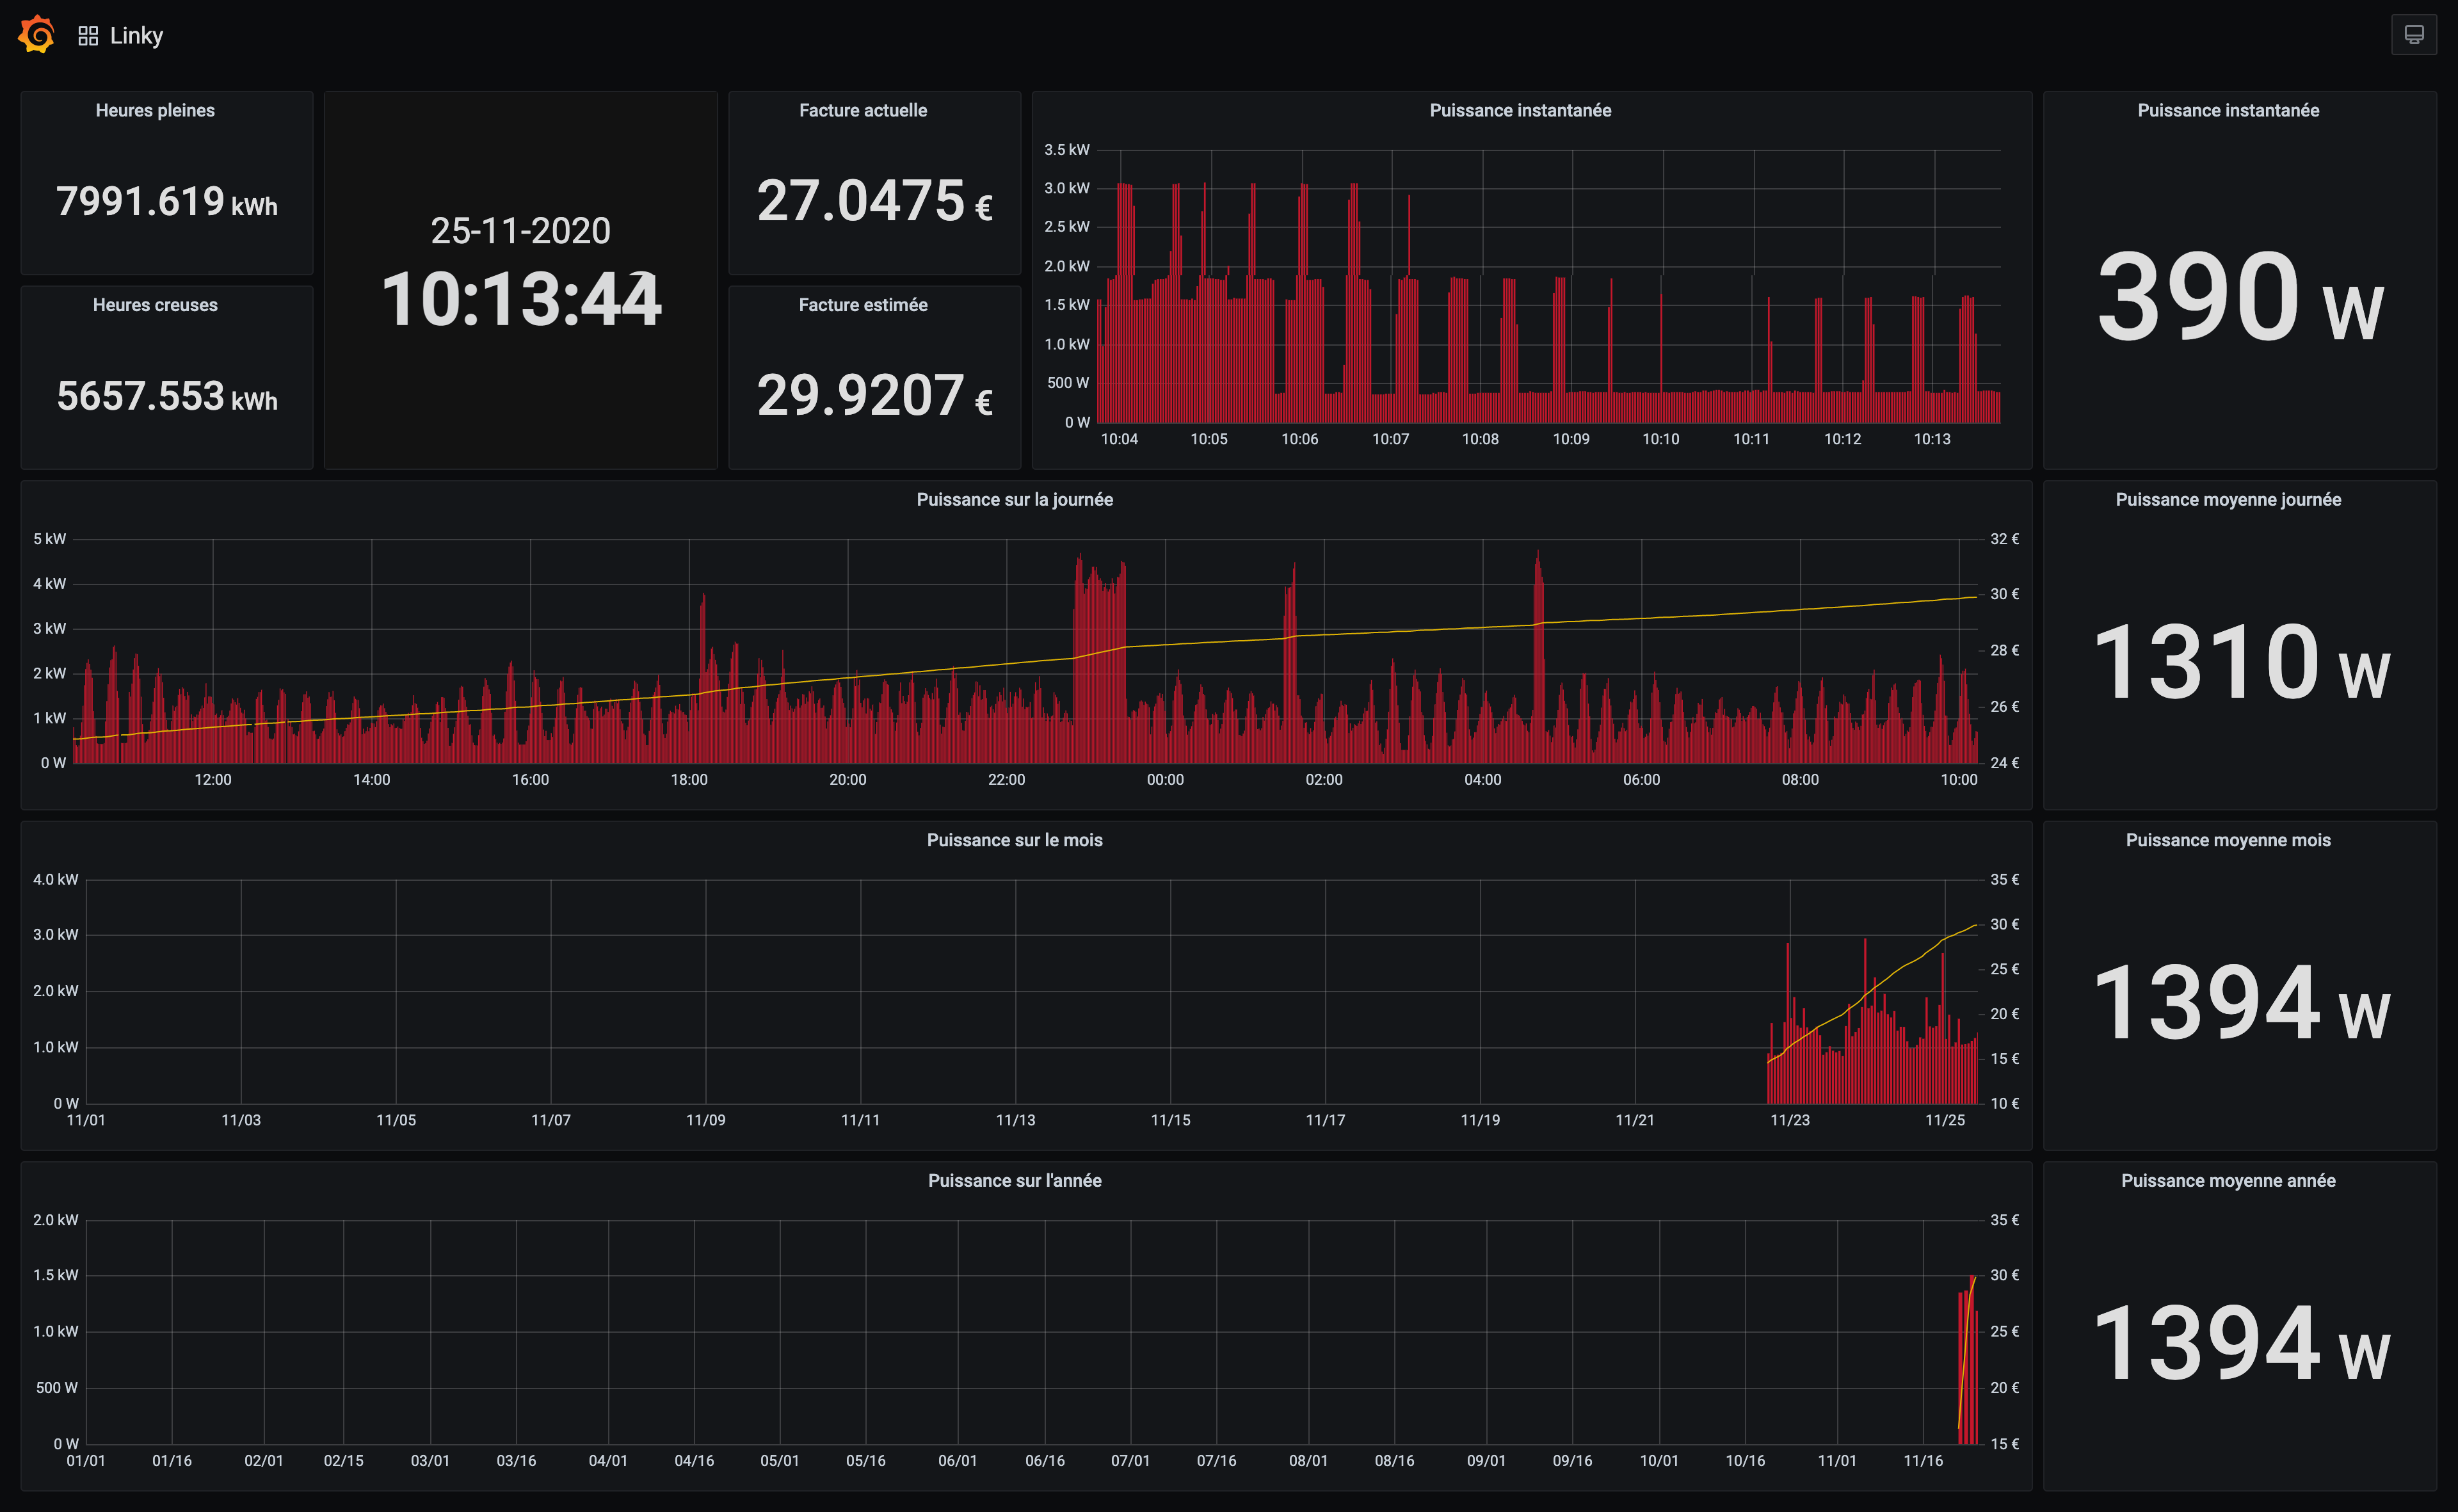
You can now browse to your RaspberryPi to see the Grafana Linky dashboard:
open http://192.168.1.200
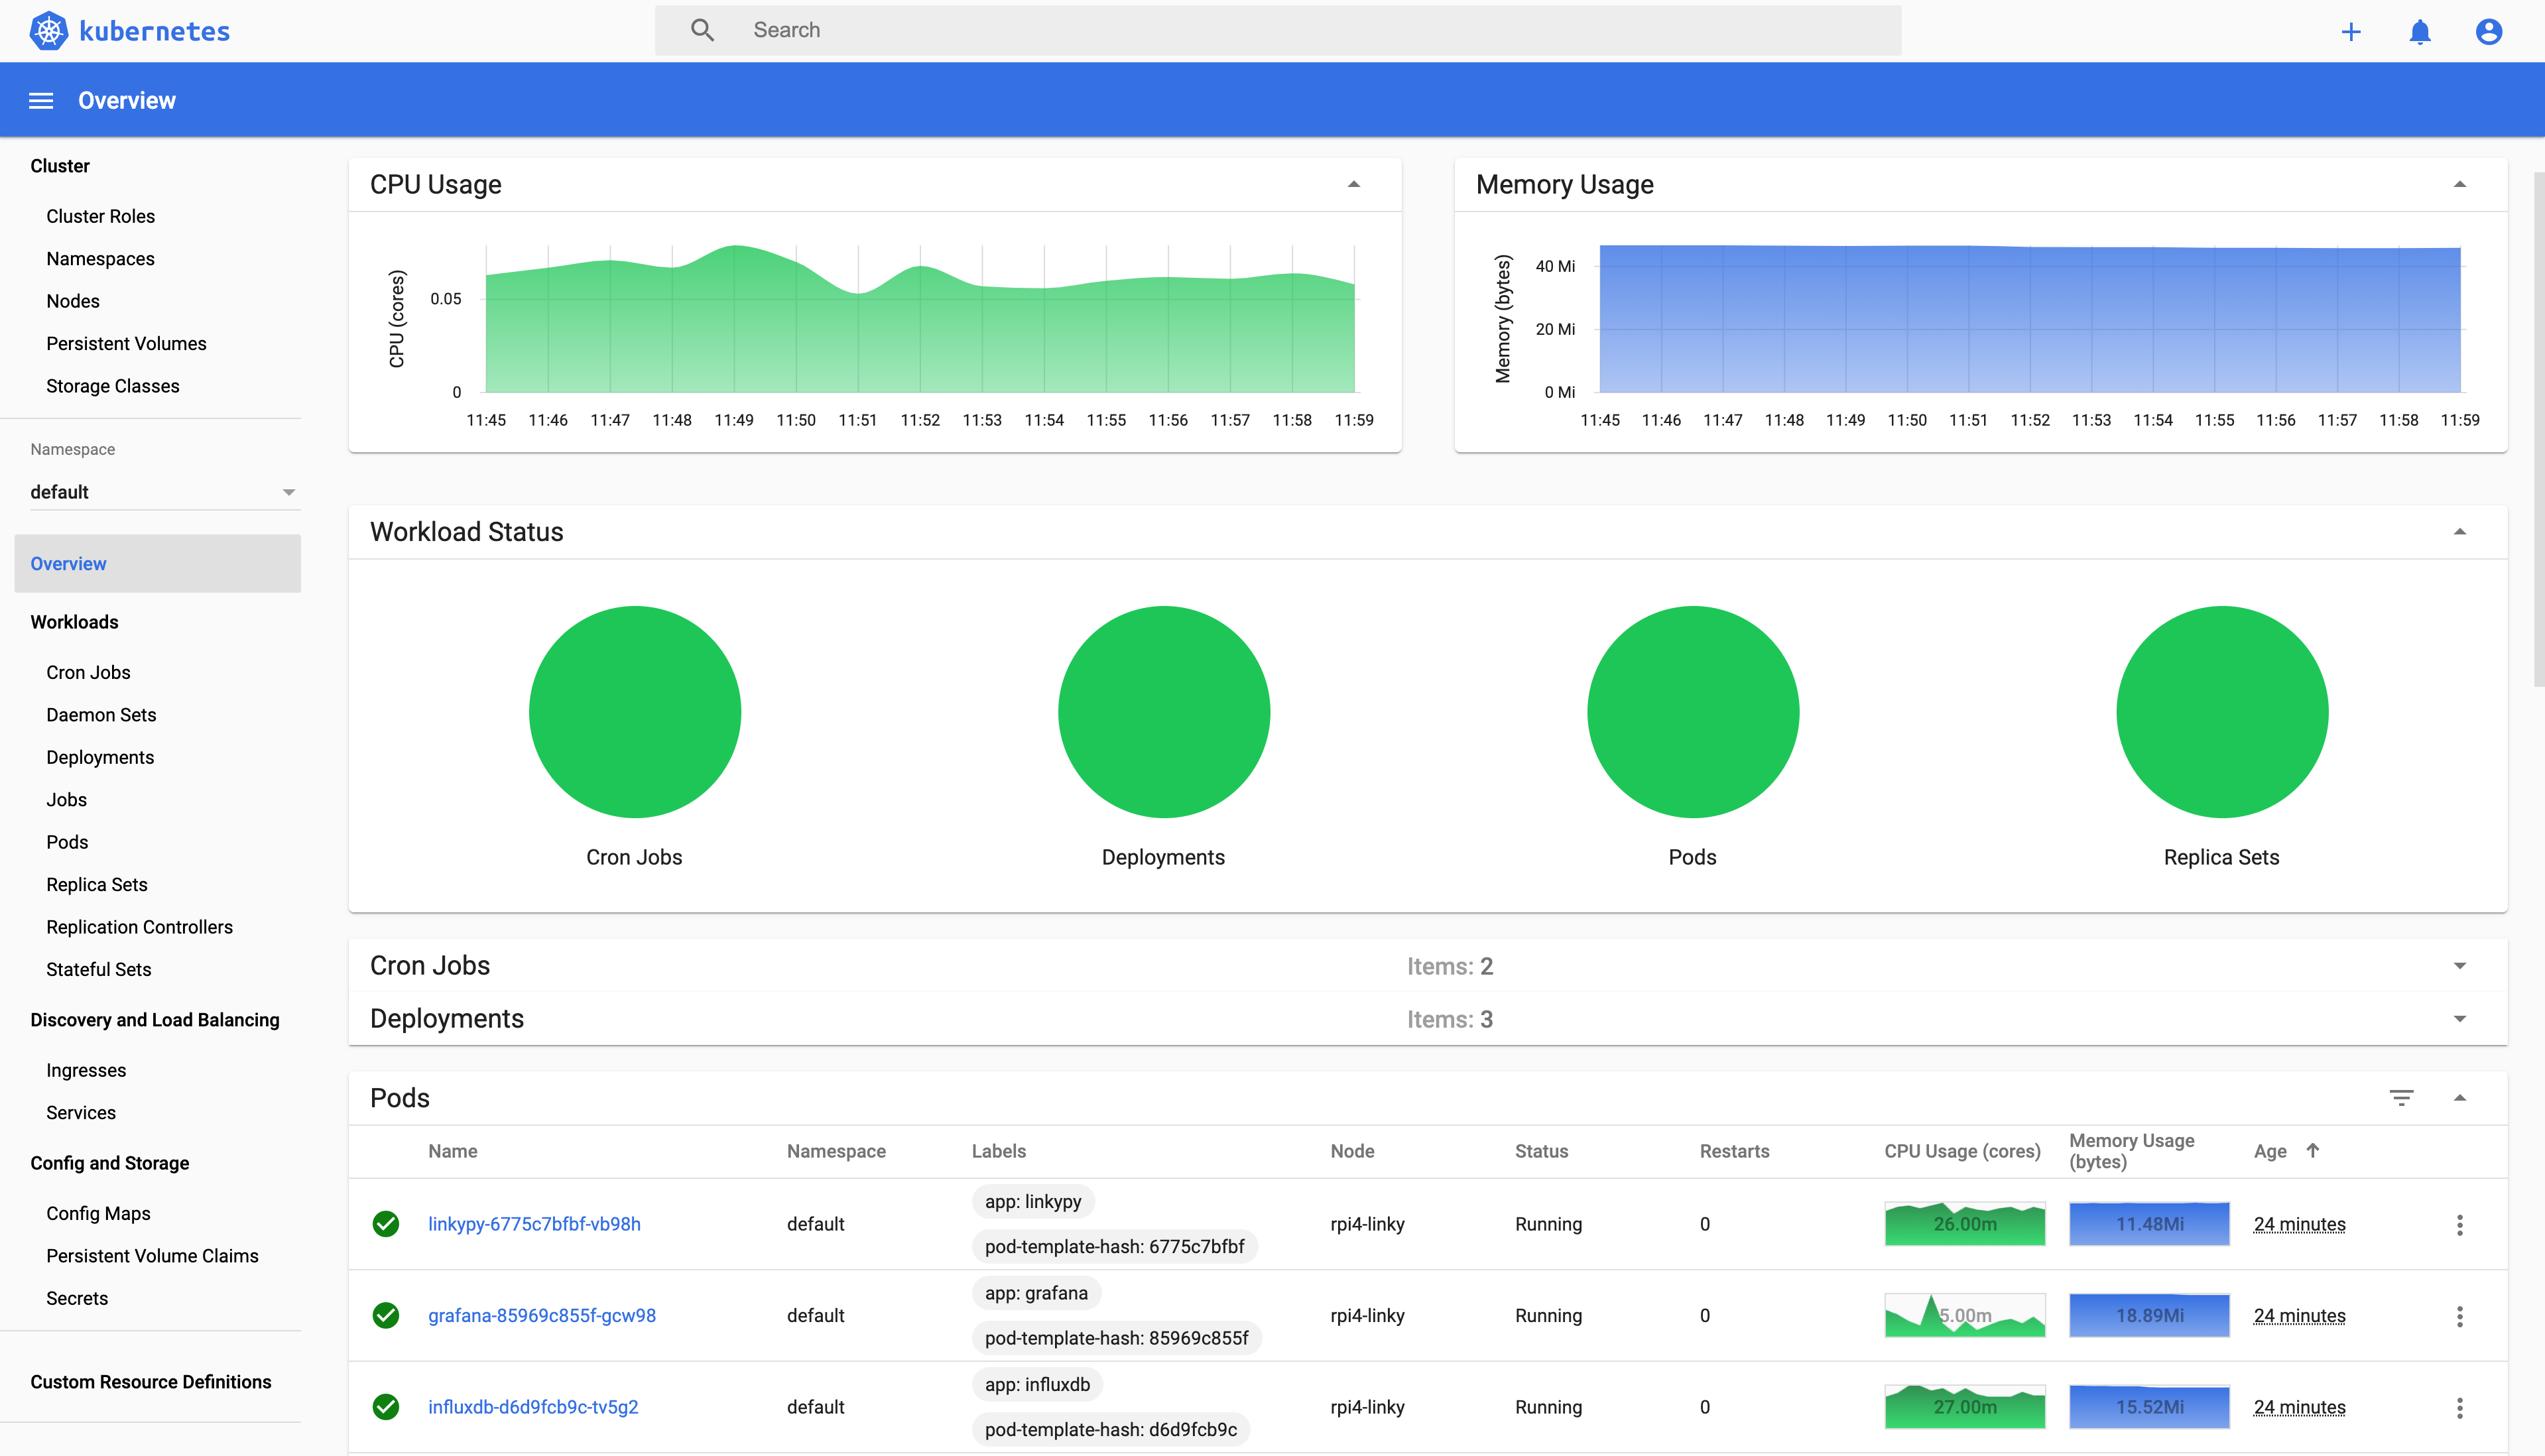
Kubernetes dashboard is installed during the process.
You can use it to find statuses and logs of different applications.
To open the Kubernetes dashboard, you must first get the authentication token:
kubectl -n kubernetes-dashboard describe secret $(kubectl -n kubernetes-dashboard get secret | grep admin-user-token | awk '{print $1}') | egrep '^token' | tr -s ' ' | cut -d' ' -f2eyJhbGciOiJSUzI1NiIsImtpZCI6IjUzU0pXZGlRcjJOdnRJc2pmbFNaclVka01YRnpLenkteUp2SUxTNHFDb00ifQ.eyJpc3MiOiJrdWJlcm5ldGVzL3NlcnZpY2VhY2NvdW50Iiwia3ViZXJuZXRlcy5pby9zZXJ2aWNlYWNjb3VudC9uYW1lc3BhY2UiOiJrdWJlcm5ldGVzLWRhc2hib2FyZCIsImt1YmVyblV0ZXMuaW8vc2VydmljZWFjY291bnQvc2VjcmV0Lm5hbWUiOiJhZG1pbi11c2VyLXRva2VuLWZnam1yIiwia3ViZXJuZXRlcy5pby9zZXJ2aWNlYWNjb3VudC9zZXQ2aWNlLWFjY291bnQubmFtZSI6ImFkbWluLXVzZXIiLCJrdWJlcm5ldGVzLmlvL3NlcnZpY2VhY2NvdW50L3NlcnZpY2UtYWNjb3VudC51aWQiOiIwYjE5YjlkNS1iYTRhLTQxMzAtYjA0NS00OGU4YWNmYjU3ODUiLCJzdWIiOiJzeXN0ZW06c2VydmljZWFjY291bnQ6a3ViZXJuZXRlcy1kYXNoYm9hcmQ6YWRtaW4tdXNlciJ9.Wr2IRLL7L6PIUVtqk_mUHpxwuAD4RNwgckYnV2uwcpxlfSPZKJENVLlVqEN7Z2XMXXNLYQbglsiq85x4QQqaLkmxNxskCgqNbaHmDao88VMArHFEbAk5eGFf7cJrcIejQ1yUzx4d0ctKcAi6YgTjlC32b9UAU4nNSU1DEuf2hgt5u9lV7JqmLr0r6tnoZHA-lO7yImhRoEiduhRbrhCLGoMD_21Kc5kHrIfnO_xrTJt0GcP15RAiLrEJKFr2kKTWNCpTHWWi4BpUD0FqlUA_90xQ0ifCWURBsqtwA-uKviRak0KKloR8fchLbl2zfOCWE5di6kUa43U367yb6Us4gQ
Then launch the Kubernetes proxy
kubectl proxy
And then browse to http://localhost:8001/api/v1/namespaces/kubernetes-dashboard/services/https:kubernetes-dashboard:/proxy/#/overview
Authenticate with the given token to view the dashboard.
You can now view pod logs to debug if needed.
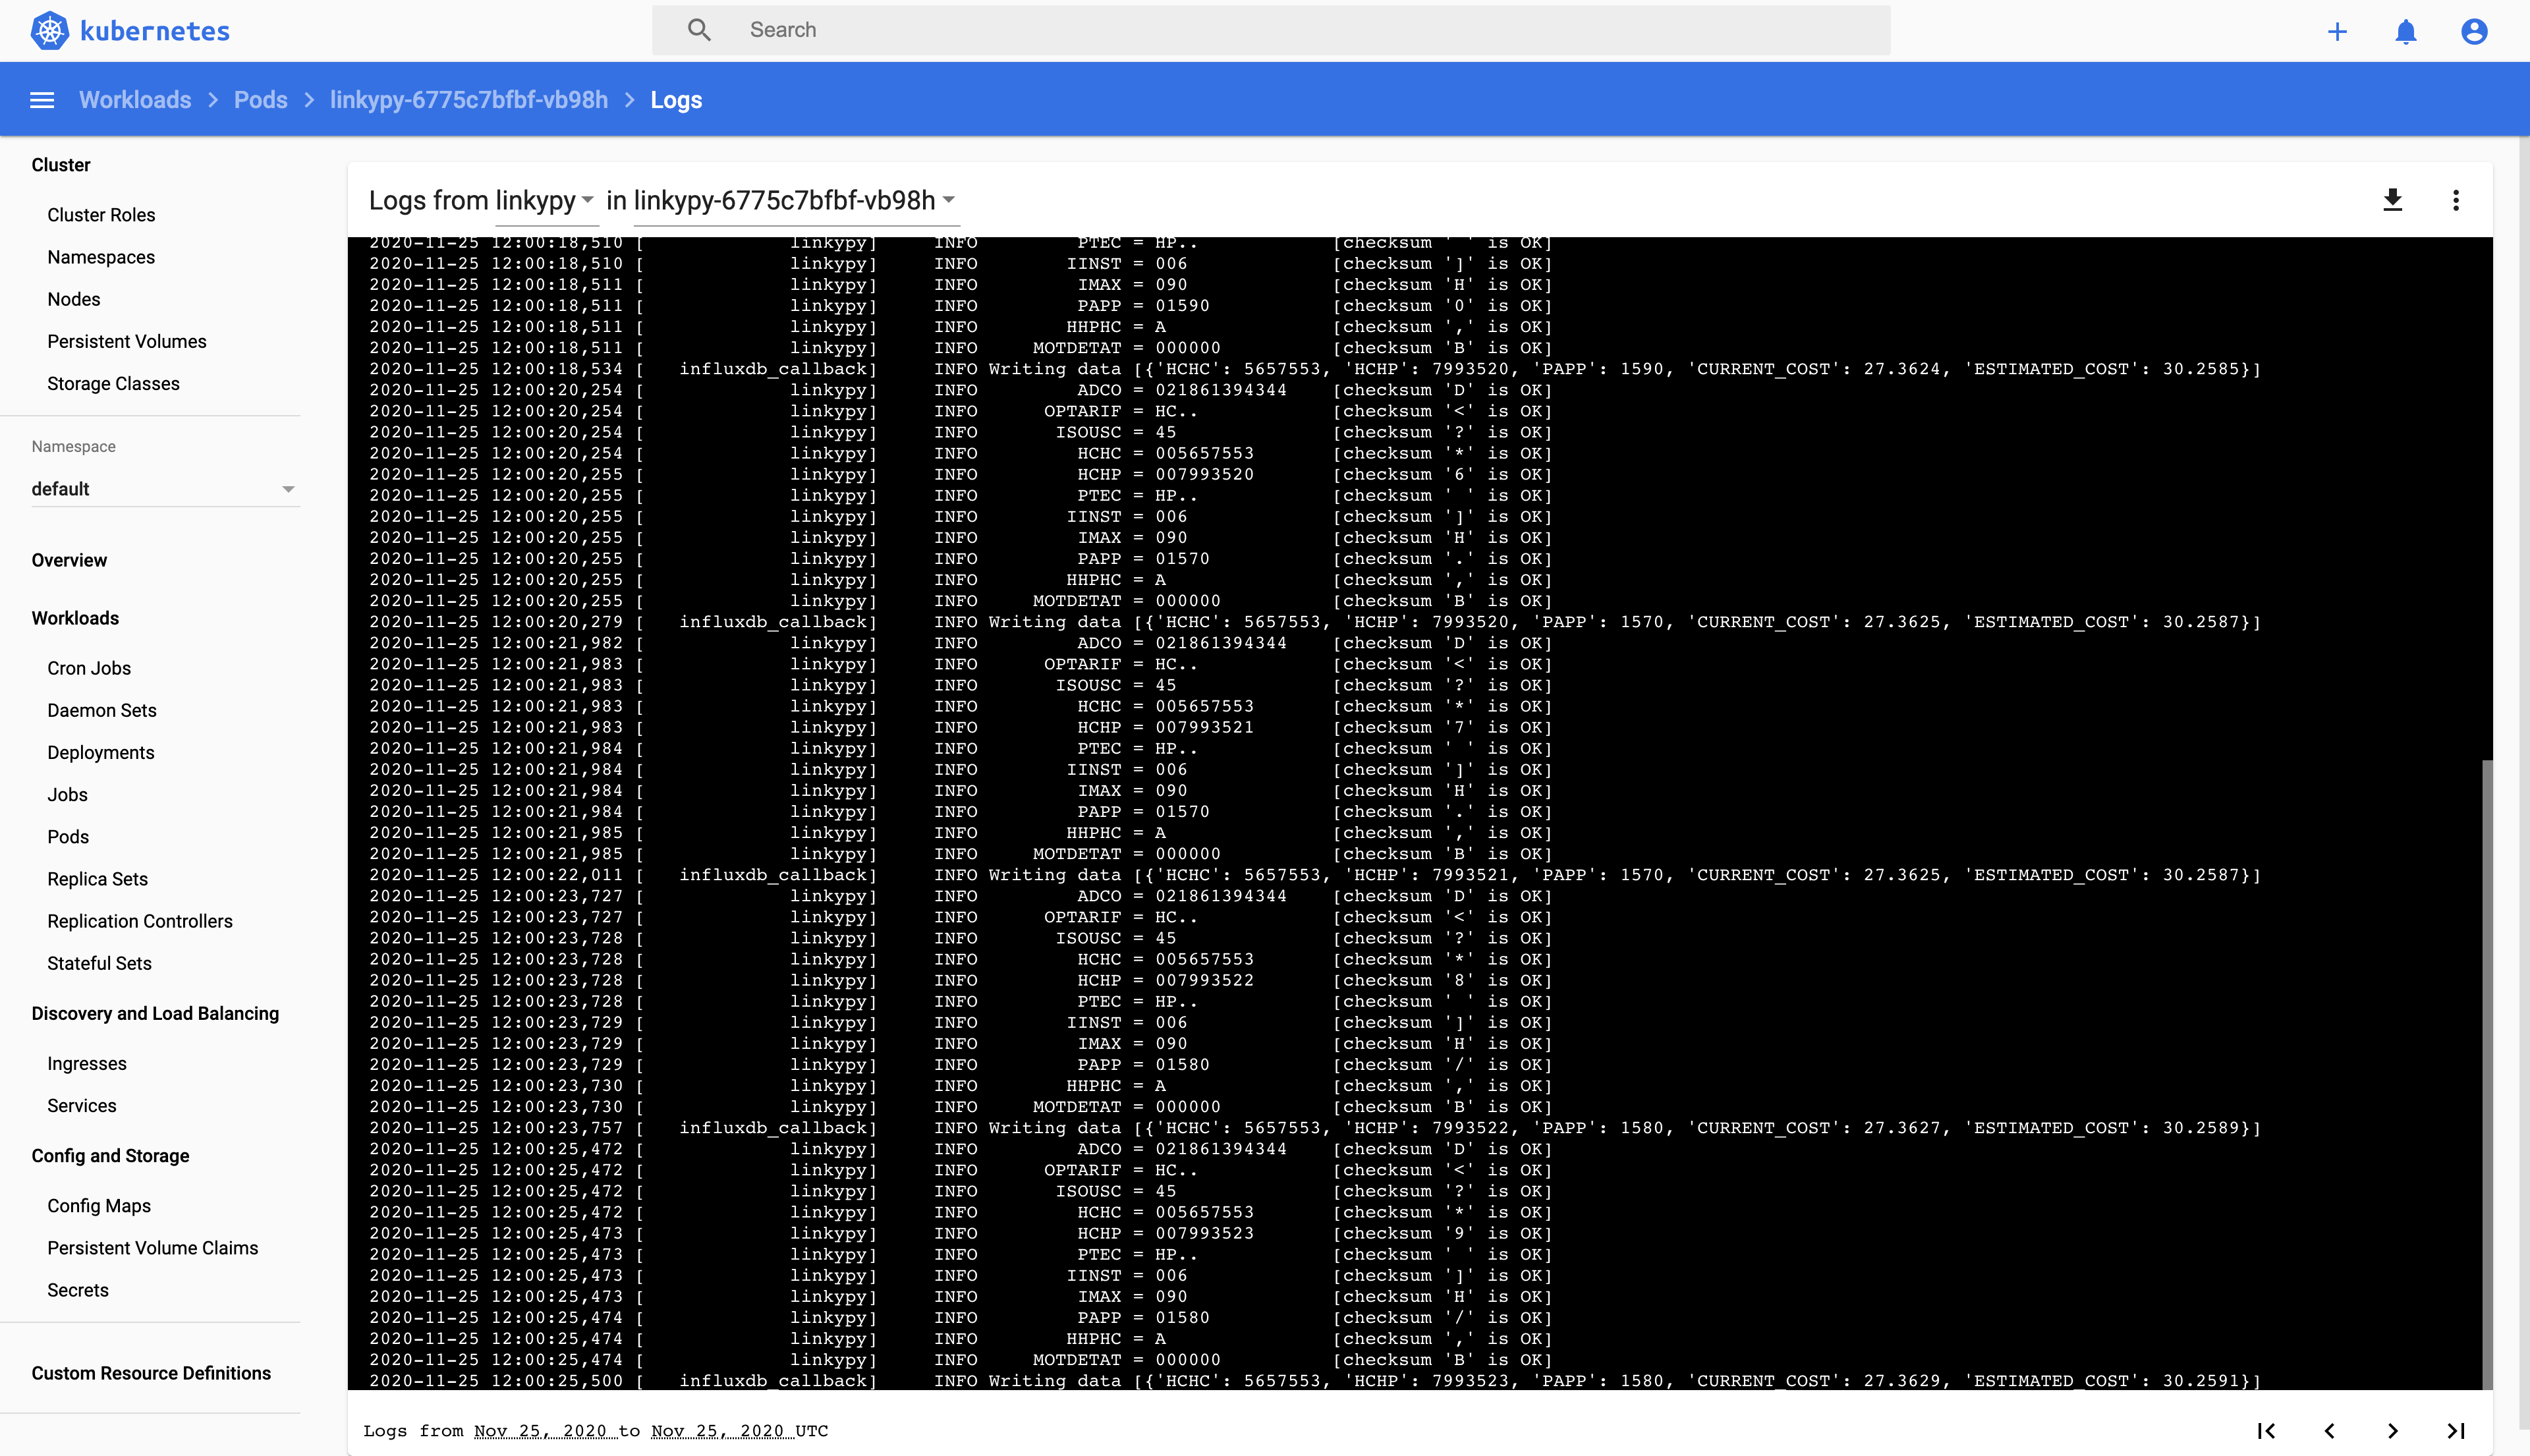
If you are having any other issues or have questions please open an issue.
Thank you to Charles (https://github.com/hallard) for the µTeleInfo USB dongle and documentation.
Thank you to Alex Ellis (https://github.com/alexellis) for his fantastic k3sup and arkade work.