Different label boundaries with skimage.morphology.watershed when using watershed_line=True and watershed_line=False
#4240
Comments
|
@packoman thanks for the report! A priori I would not think that the lines should be different. We'll investigate! |
|
I confirm the bug, still happening with |
|
I confirm for
import numpy as np
import matplotlib.pyplot as plt
import skimage.morphology, skimage.segmentation, skimage.feature

plt.ion()

def get_water(A, wA=None, maxes=None, show=True):
    '''Plot watershed A and mark local maxima'''
    if maxes is None:
        maxes = skimage.feature.peak_local_max(A)
    maxes_mask = np.zeros_like(A)
    for i,m in enumerate(maxes):
        maxes_mask[m[0],m[1]] = i+1
    if wA is None:
        wA = skimage.segmentation.watershed(-A, markers=maxes_mask)
    if show:
        # cycle through colors rather than group nearby
        #plt.imshow(skimage.color.label2rgb(wA, A, colors=plt.cm.Set1.colors))
        plt.figure()
        plt.imshow(wA, cmap=plt.cm.Set1)
        # careful with xy vs row/col
        plt.plot(maxes[:,1], maxes[:,0], 'kx', label='Maxima')
        plt.legend()
    return wA, maxes

A = np.load('data.npy')
wA, maxA = get_water(A, show=False) # no boundaries
maxes_mask = np.zeros_like(A)
for i,m in enumerate(maxA):
    maxes_mask[m[0],m[1]] = i+1
wA2 = skimage.segmentation.watershed(-A, markers=maxes_mask, watershed_line=True) # include boundaries
bA = wA2 == 0

ncolor = len(plt.cm.Set1.colors)
fig, ax = plt.subplots(1,5)
fig.set_size_inches(16,4)
plt.subplots_adjust(wspace=0, hspace=0)
ax[0].imshow(A)
ax[1].axis('equal')
cs = ax[1].contour(np.flipud(A), levels=10)
ax[1].clabel(cs, fontsize=8, inline_spacing=0)
ax[2].imshow(wA,cmap=plt.cm.Set1, vmin=0, vmax=ncolor)
ax[3].imshow(wA2,cmap=plt.cm.Set1, vmin=0, vmax=ncolor)
ax[4].imshow(bA, vmin=0, vmax=1)
for col in range(5):
    if col == 1:
        ax[col].plot(maxA[:,1], 64-maxA[:,0], 'kx', label='Maxima')
    else:
        ax[col].plot(maxA[:,1], maxA[:,0], 'kx', label='Maxima')
    ax[col].set_xticklabels([])
    ax[col].set_yticklabels([])
    ax[col].set_xticks([])
    ax[col].set_yticks([])
    ax[col].set_xticklabels([])
    ax[col].set_yticklabels([])
    ax[col].set_xticks([])
    ax[col].set_yticks([])
Is it possible this is due to some numerical imprecision/instability? |
|
Thanks for the additional report @dvbuntu! Do you think you could share your data.npy file with us to help us investigate? |
|
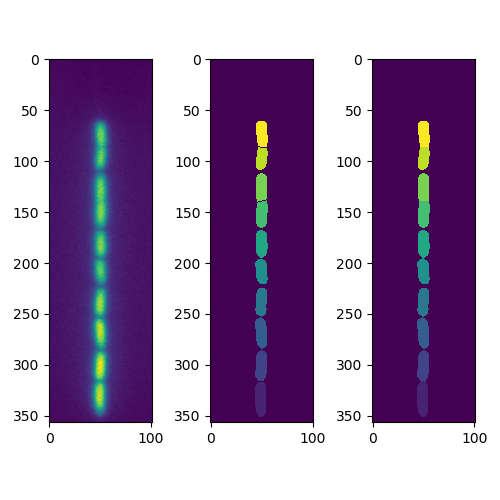
Working on this at euroscipy2022 :) [edit: No good progress here unfortunately, I was too busy :/] Starting with a reproducible example based on a gallery example: import numpy as np
import matplotlib.pyplot as plt
from scipy import ndimage as ndi
from skimage.segmentation import watershed
from skimage.feature import peak_local_max
# Generate an initial image with two overlapping circles
x, y = np.indices((80, 80))
x1, y1, x2, y2 = 28, 28, 44, 52
r1, r2 = 16, 20
mask_circle1 = (x - x1)**2 + (y - y1)**2 < r1**2
mask_circle2 = (x - x2)**2 + (y - y2)**2 < r2**2
image = np.logical_or(mask_circle1, mask_circle2)
# Now we want to separate the two objects in image
# Generate the markers as local maxima of the distance to the background
distance = ndi.distance_transform_edt(image)
coords = peak_local_max(distance, footprint=np.ones((3, 3)), labels=image)
mask = np.zeros(distance.shape, dtype=bool)
mask[tuple(coords.T)] = True
markers, _ = ndi.label(mask)
labels = watershed(-distance, markers, mask=image)
labels_line = watershed(-distance, markers, mask=image, watershed_line=True)
fig, axes = plt.subplots(ncols=3, figsize=(9, 3), sharex=True, sharey=True)
ax = axes.ravel()
ax[0].imshow(image, cmap=plt.cm.gray)
ax[0].set_title('Overlapping objects')
ax[1].imshow(labels, cmap=plt.cm.nipy_spectral)
ax[1].set_title('Separated objects')
ax[2].imshow(labels_line, cmap=plt.cm.nipy_spectral)
ax[2].set_title('Separated objects with line')
for a in ax:
a.set_axis_off()
fig.tight_layout()
plt.show() |
Description
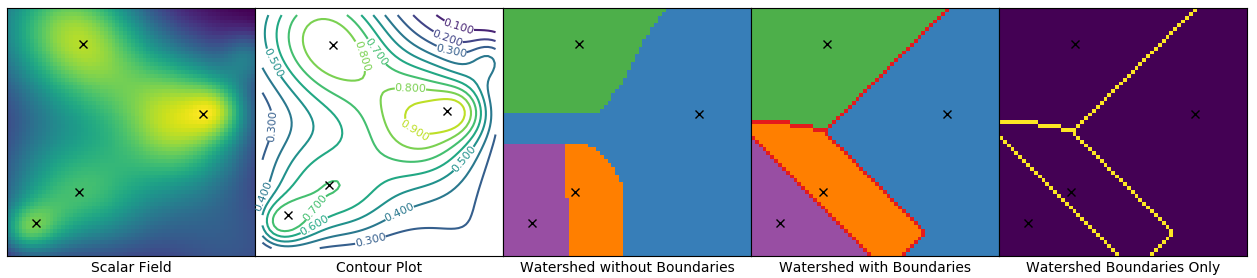
When doing watersheding I get a different boundary between adjacent labels, when using
watershed_line=Trueandwatershed_line=False(see image).If you compare the two results in the image below, you see that with
watershed_line=Truethe watershed lines/label boundaries are somewhat diagonal, whereas withwatershed_line=Falsethe boundaries are perfectly horizontal.Is this expected behavior?
Original image:

Result from code below:
Way to reproduce
Version information
The text was updated successfully, but these errors were encountered: