Add gallery example for structure_tensor... in 3D! #5012
Conversation
|
Hello @mkcor! Thanks for updating this PR. We checked the lines you've touched for PEP 8 issues, and found:
Comment last updated at 2021-01-27 10:25:51 UTC |
|
Yes I would and they are f-strings |
|
@scikit-image/core please review when you get a chance! |
Co-authored-by: Riadh Fezzani <rfezzani@gmail.com>
|
@rfezzani thank you for the thorough review! |
| coords = np.unravel_index(eigen.argmax(), eigen.shape) | ||
| assert coords[0] == 0 # by definition | ||
| coords | ||
|
|
There was a problem hiding this comment.
I think it would be nice to also plot all 3 eigenvalues for a single slice (e.g. 1 subplot per eigenvalue, using uniform brightness scale across subplots).
There was a problem hiding this comment.
I was suggesting a figure something like this, which shows the spatial distribution of the eigenvalues. Do you think it is helpful?
fig, axes = plt.subplots(1, 3)
vmax = eigen[0][coords[1]].max()
axes[0].imshow(eigen[0][coords[1]], vmin=0, vmax=vmax, cmap=plt.cm.viridis)
axes[0].set_title('eigenvalue 0')
axes[1].imshow(eigen[1][coords[1]], vmin=0, vmax=vmax, cmap=plt.cm.viridis)
axes[1].set_title('eigenvalue 1')
axes[2].imshow(eigen[2][coords[1]], vmin=0, vmax=vmax, cmap=plt.cm.viridis)
axes[2].set_title('eigenvalue 2')
for ax in axes:
    ax.set_axis_off()
There was a problem hiding this comment.
I'm aware I hadn't addressed all of your review comments -- looking now! Thanks.
There was a problem hiding this comment.
Yes, I think it is helpful: It makes it easier to follow the rest of the story. I've added the plot in d82d754. I couldn't resist but use facet_col with plotly's imshow... ❤️ @emmanuelle 😉
Co-authored-by: Gregory R. Lee <grlee77@gmail.com>
|
Thank you @mkcor 🎉. |
Description
Addresses part of #4831.
With this PR, I'm following up on #4831 (comment).
@emmanuelle I tried telling a story but, in terms of applications, it's more didactic than scientific.
@GenevieveBuckley I used a small region of the kidney image!
I wanted to include some 3D rendering with Plotly, like:
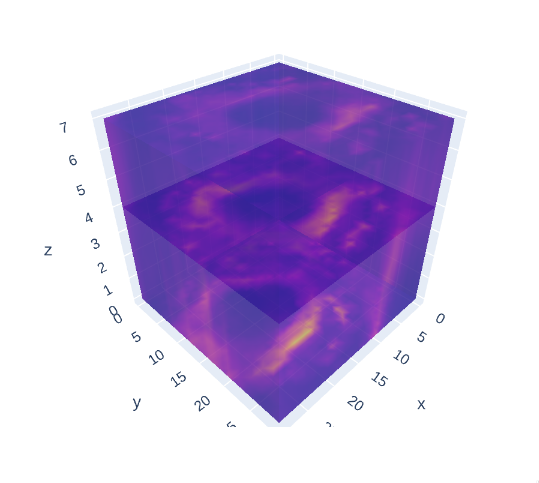
but it would only spit out a JSON:
{'text/html': '<div> <script src="https://cdnjs.cloudflare.com/ajax/libs/mathjax/2.7.5/MathJax.js?config=TeX-AMS-MML_SVG"></script><script type="text/javascript">if (window.MathJax) {MathJax.Hub.Config({SVG: {font: "STIX-Web"}});}</script> <script type="text/javascript">window.PlotlyConfig = {MathJaxConfig: \'local\'};</script>\n <script src="https://cdn.plot.ly/plotly-latest.min.js"></script> <div id="de5ac8b7-d7bc-41f1-a094-bc28e8cdaa06" class="plotly-graph-div" style="height:525px; width:100%;"></div> <script type="text/javascript"> window.PLOTLYENV=window.PLOTLYENV || {}; if (document.getElementById("de5ac8b7-d7bc-41f1-a094-bc28e8cdaa06")) { Plotly.newPlot( "de5ac8b7-d7bc-41f1-a094-bc28e8cdaa06", [{"opacity": 0.5, "slices": {"z": {"locations": [5], "show": true}}, "type": "volume", "value": [774, 566, 384, 333, ...(plus it would be too heavy).
Checklist
./doc/examples(new features only)./benchmarks, if your changes aren't covered by anexisting benchmark
For reviewers
later.
__init__.py.doc/release/release_dev.rst.