-
Notifications
You must be signed in to change notification settings - Fork 579
New issue
Have a question about this project? Sign up for a free GitHub account to open an issue and contact its maintainers and the community.
By clicking “Sign up for GitHub”, you agree to our terms of service and privacy statement. We’ll occasionally send you account related emails.
Already on GitHub? Sign in to your account
plotting data horizontal plots with shared axis #1486
Comments
|
Hi @rbf22 , |
I’ve updated the issue. Thanks! |
|
mmh a preoducible example means something like this: adata = sc.datasets.pbmc68k_reduced()
adata.var["mt"] = adata.var_names.str.startswith(
"MT-"
) # annotate the group of mitochondrial genes as 'mt'
sc.pp.calculate_qc_metrics(
adata, qc_vars=["mt"], percent_top=None, log1p=False, inplace=True
)
sc.pl.violin(
adata,
[
"n_genes_by_counts",
"total_counts",
],
jitter=0.4,
multi_panel=True,
)and this works. what's |
|
Pct_counts_house could be replaced by mt in your example. I’ll try you example and post the result. |
|
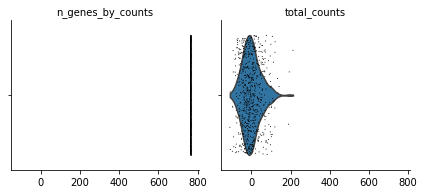
This does not fail, but it does produce the warnings: /Users/banana/opt/miniconda3/lib/python3.8/site-packages/seaborn/_core.py:1303: UserWarning: Vertical orientation ignored with only Here is the plot that shows that individual plots are horizontal compared to the previous versions that were vertical. Also you can see that the plots share the same x axis, which should not be the case as a default for scanpy I suspect. To see how scanpy has historically plotted this data check out: https://scanpy-tutorials.readthedocs.io/en/latest/pbmc3k.html This was generated with seaborn version 0.11.0 (sept 2020) https://seaborn.pydata.org/whatsnew.html |
|
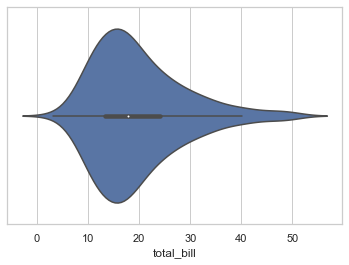
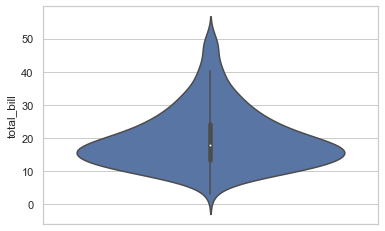
The line that creates this in scanpy looks like: |
|
Yes, this looks like the same issue, happy to close this for now. Is matplotlib more stable for plotting? |
|
sorry, i miss the point, How can we fix the problem, I met the same problem |
|
try updating scanpy |
|
Thank you,I will have a try
发自我的iPhone
…------------------ Original ------------------
From: giovp <notifications@github.com>
Date: Mon,Jan 4,2021 10:45 PM
To: theislab/scanpy <scanpy@noreply.github.com>
Cc: Dan <735393152@qq.com>, Comment <comment@noreply.github.com>
Subject: Re: [theislab/scanpy] plotting data horizontal plots with shared axis (#1486)
try updating scanpy
—
You are receiving this because you commented.
Reply to this email directly, view it on GitHub, or unsubscribe.
|


The problem here is that the violin plots are horizontal rather than vertical and that they share the same x-axis scale. Plotting two sets of numbers 10s vs 10,000s the 10s data are not observable.
This looks like a change in the way that seaborn wants violin plots called, based solely on the error below.
Note: Please read this guide detailing how to provide the necessary information for us to reproduce your bug.
Minimal code sample (that we can copy&paste without having any data)
Versions
WARNING: If you miss a compact list, please try
print_header!anndata 0.7.4
scanpy 1.6.0
sinfo 0.3.1
PIL 8.0.1
anndata 0.7.4
appnope 0.1.0
attr 20.2.0
backcall 0.2.0
cffi 1.14.0
cycler 0.10.0
cython_runtime NA
dateutil 2.8.1
decorator 4.4.2
get_version 2.1
h5py 2.10.0
idna 2.9
ipykernel 5.3.4
ipython_genutils 0.2.0
ipywidgets 7.5.1
jedi 0.17.2
joblib 0.17.0
jsonschema 3.2.0
kiwisolver 1.2.0
legacy_api_wrap 1.2
llvmlite 0.34.0
matplotlib 3.3.2
mpl_toolkits NA
natsort 7.0.1
nbformat 5.0.8
numba 0.51.2
numexpr 2.7.1
numpy 1.19.1
packaging 20.4
pandas 1.1.2
parso 0.7.1
pexpect 4.8.0
pickleshare 0.7.5
pkg_resources NA
plotly 4.12.0
prompt_toolkit 3.0.8
ptyprocess 0.6.0
pvectorc NA
pygments 2.7.1
pyparsing 2.4.7
pyrsistent NA
pytz 2020.1
retrying NA
scanpy 1.6.0
scipy 1.5.2
seaborn 0.11.0
setuptools_scm NA
sinfo 0.3.1
six 1.15.0
sklearn 0.23.2
statsmodels 0.12.1
storemagic NA
tables 3.6.1
tornado 6.0.4
traitlets 5.0.5
wcwidth 0.2.5
zmq 19.0.2
IPython 7.18.1
jupyter_client 6.1.7
jupyter_core 4.6.3
notebook 6.1.4
Python 3.8.3 (default, May 19 2020, 13:54:14) [Clang 10.0.0 ]
macOS-10.15.7-x86_64-i386-64bit
4 logical CPU cores, i386
Session information updated at 2020-11-05 17:47
The text was updated successfully, but these errors were encountered: