| name | description | author | image |
|---|---|---|---|
Make a 3D Mountain |
Created San Bruno Mountain with the help of Python |
@shivesh01 |
Hey, do you know where San Bruno Mountain is? Let's take a roller coaster ride and see where it is in Google Map.

The reason why I am showing you this, because You are going to make a Mountain with Python. You read it correctly will make a Mountain!!!

Click here to see a working demo of today's project.
Now here is a step by step guide for how to prepare the setup for our project.
Today, you'll be using repl.it to write code. It is an online, instant development environment to learn, build, collaborate, and host your project. So you don’t have to waste time while setting up a development environment.
- To help get you started, you can fork our repl which contains a mountain.csv file. Click here to load up that repl for forking.
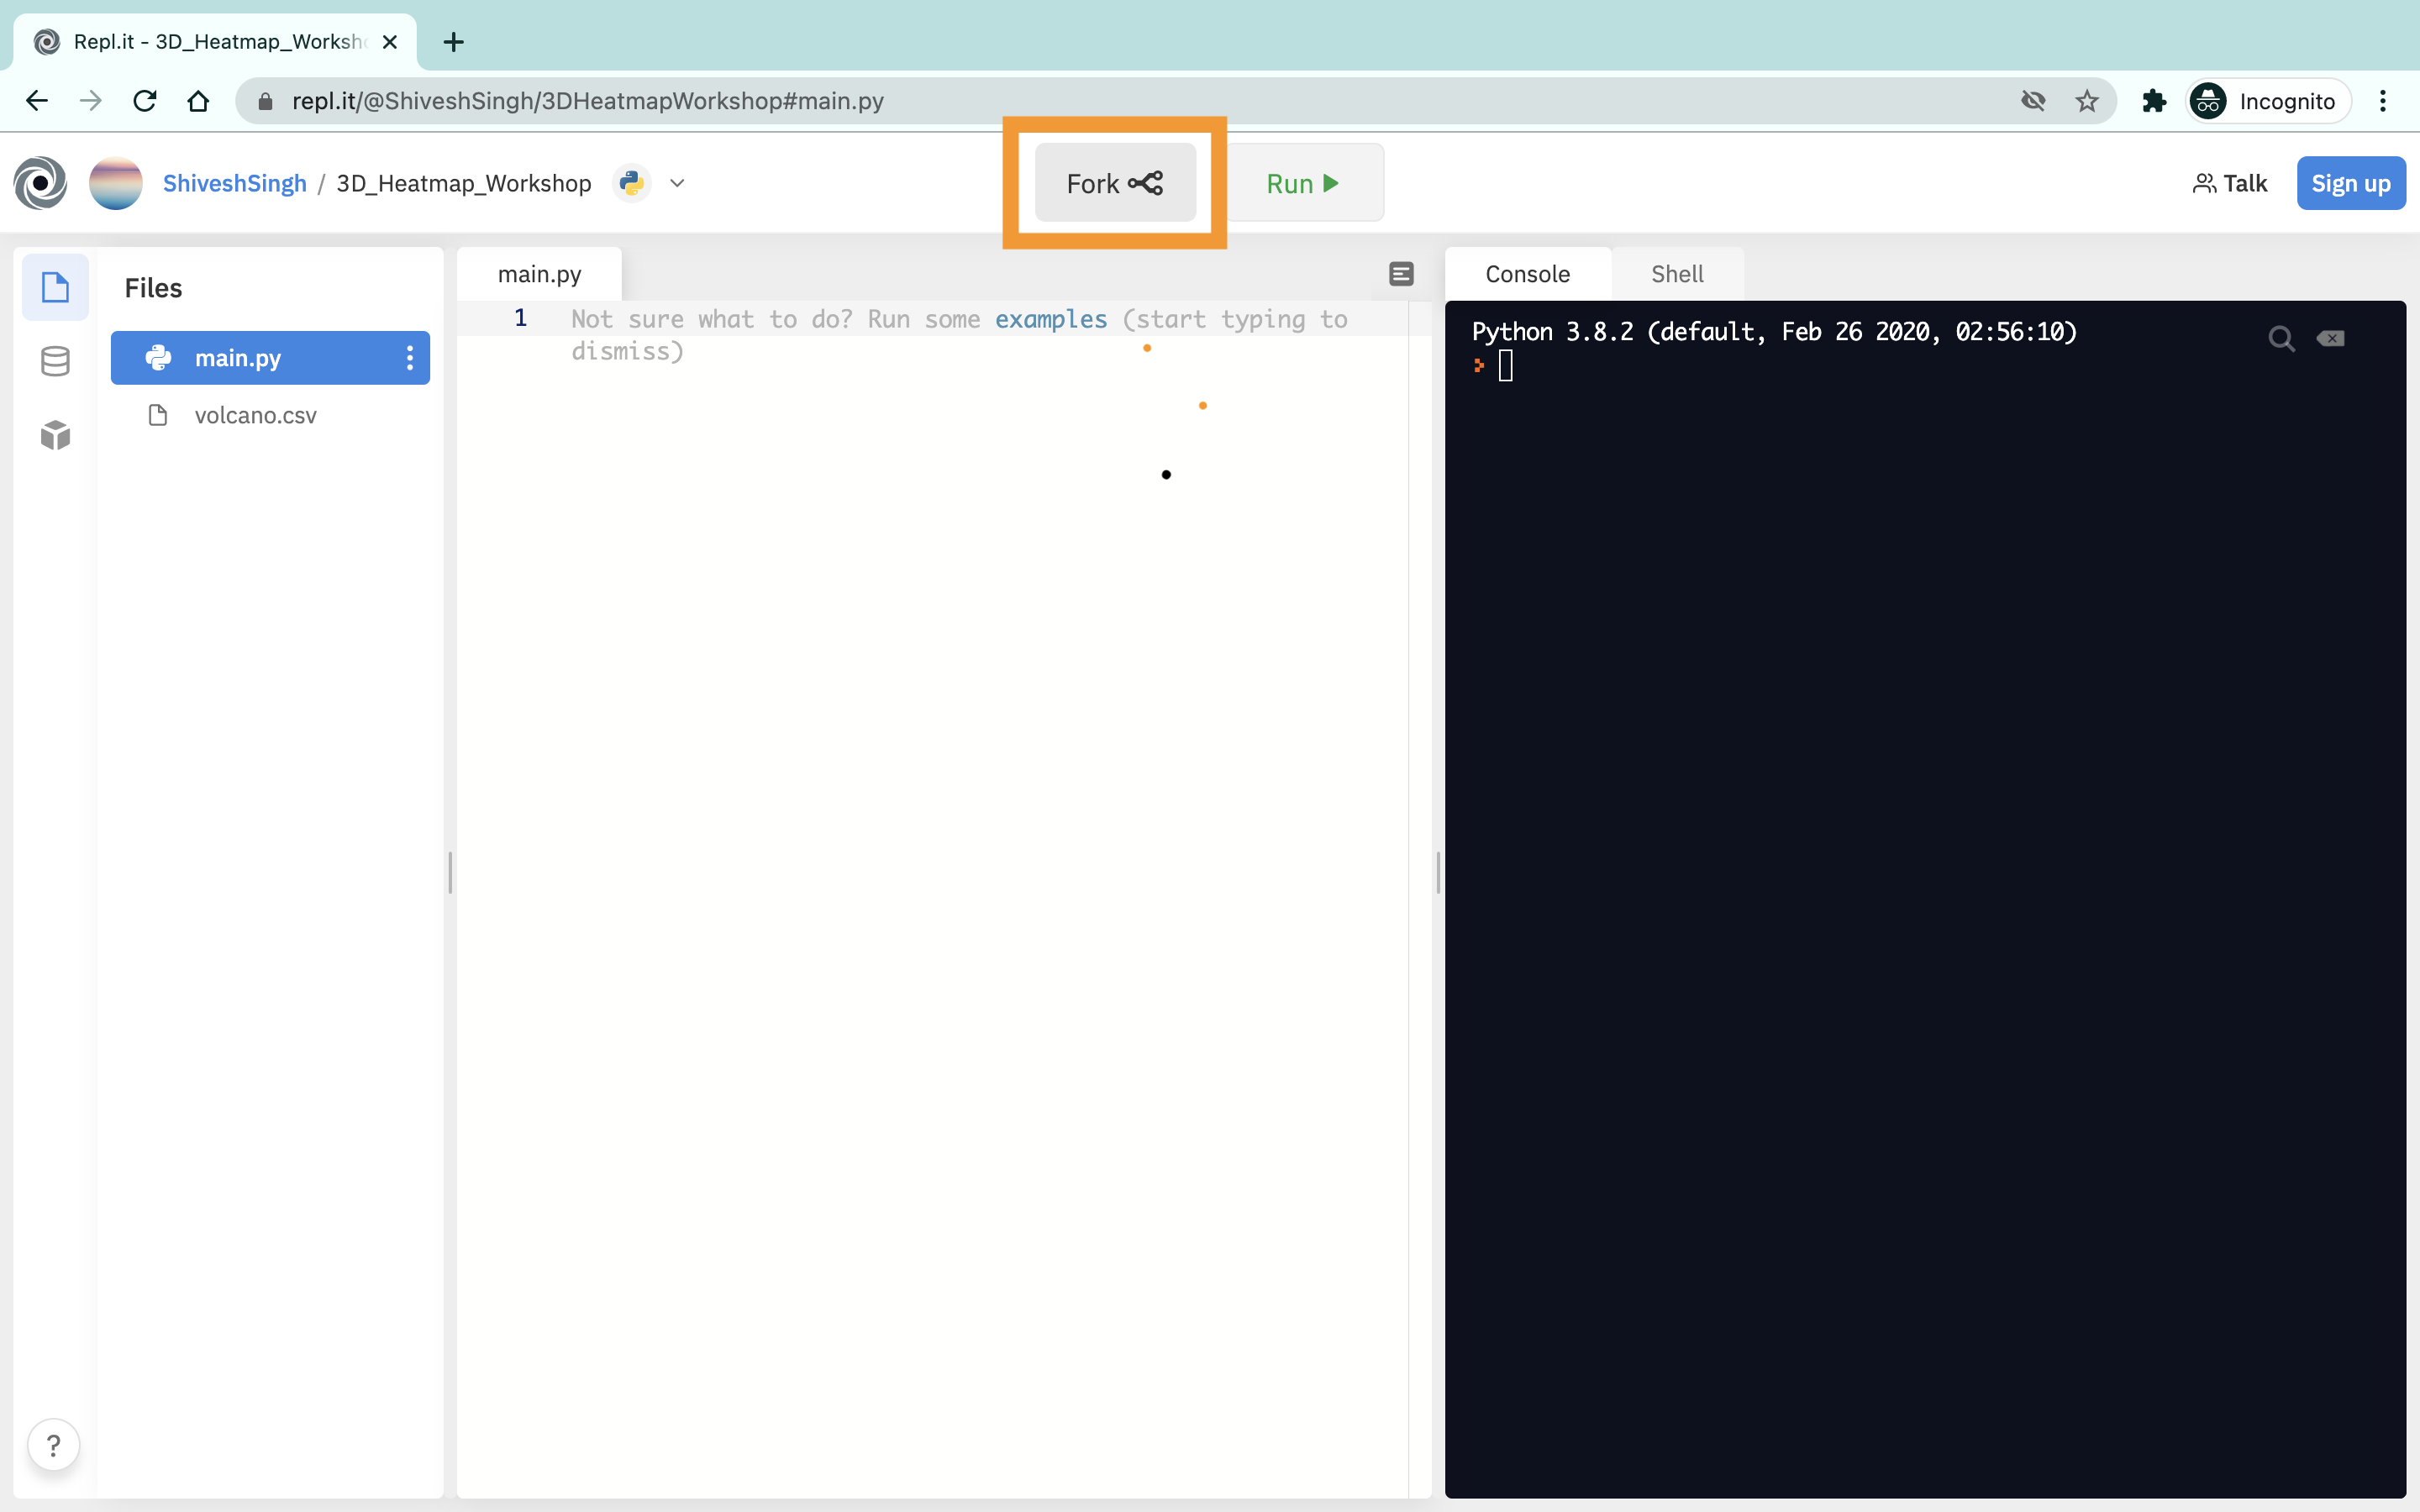
- The setup is complete.
Here are the libraries we'll be using today:
I hope you are excited! Let's start the coding part. First, we need to import libraries, and I know, you will think what those are, they are sweet and simple pieces of reusable codes containing modules, and modules containing functions, and we're able to easily import them using the import function with the library name into our project and use them.
import pandas as pd'pandas' is one of the popular libraries. It allows importing data from various file formats such as comma-separated-values(CSV), JSON, SQL, Microsoft Excel. It also allows various data manipulation operations such as merging, reshaping, selecting, as well as data cleaning, and much more with data-sets.
Wondering what are data-sets? examples of some kind the data-sets are:
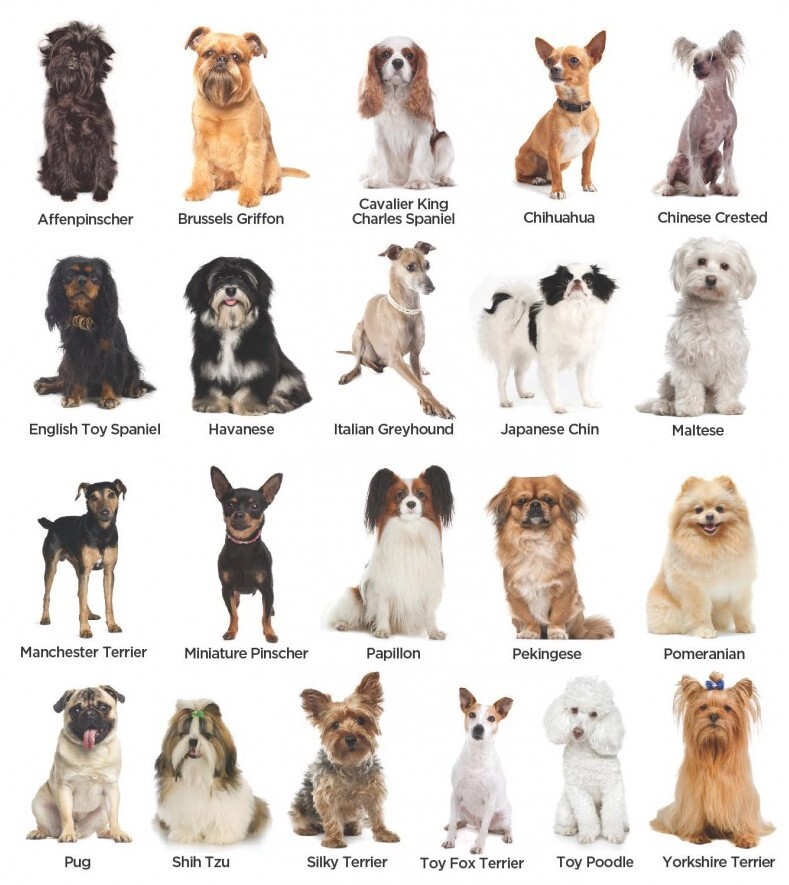
Image Dataset
How cute is Pomeranian?
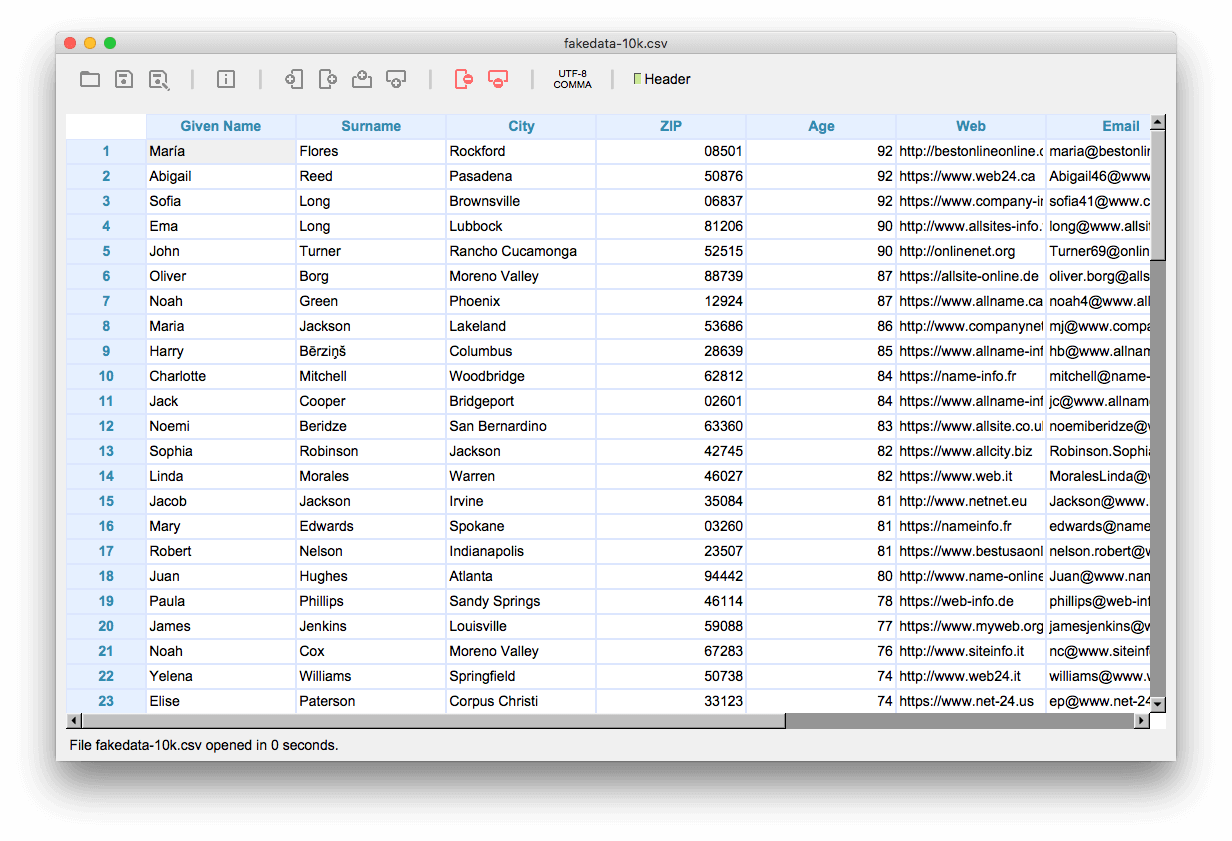
CSV Dataset
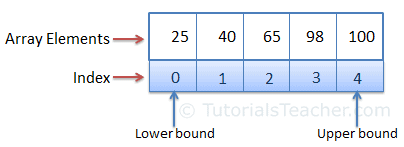
import numpy as npThe numpy is used to work with arrays. An array is a data-type consisting of a collection of elements, each identified by at least one array index or key.
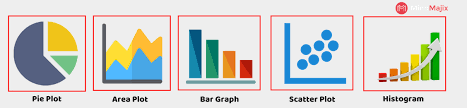
import matplotlib.pyplot as pltThe matplotlib is used for data visualization like to make a histogram, scatter plot and bar-graph e.t.c.
from mpl_toolkits.mplot3d import Axes3DThe mpl_toolkits are collections of functions that extend the matplotlib application. Which will enable us to work with 3D Plane.
DataFrame = pd.read_csv('mountain.csv')Created a variable DataFrame to read the mountain.csv with the help of the pandas library. Now we need to make rearrangements in DataFrame in order to make a plot.
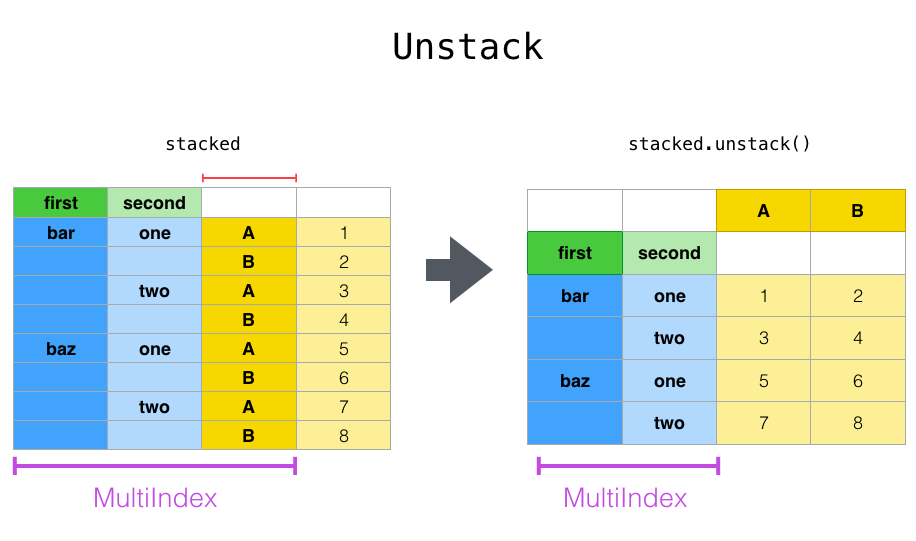
DataFrame = DataFrame.unstack()The unstack() function in the data frame unstacks the row to columns. Hence it makes changes to your Dataframe. Let's see with an example.
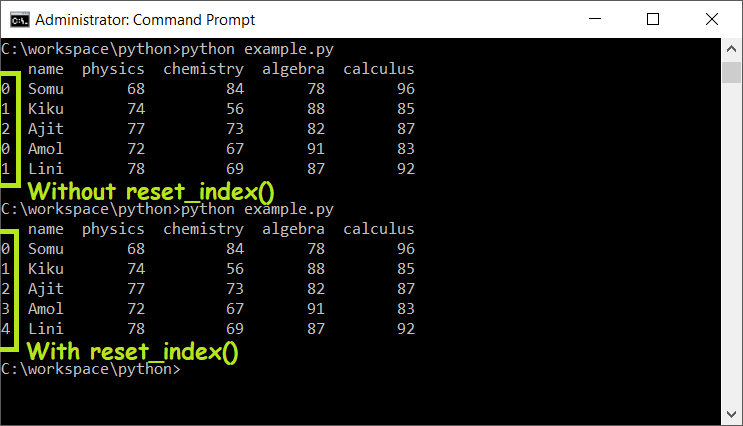
DataFrame = DataFrame.reset_index()When you concatenate, sort, join or do some rearrangements with your DataFrame, the index gets shuffled or out of order. To reset the index of a DataFrame, You can use reset_index() to sort indexes.
DataFrame.columns = ['X', 'Y', 'Z']Your DataFrame contains three columns without labels, so you need to assign labels to columns, and using DataFrame.columns assign the first column to be X, the second column to be Y, and the third column to be Z. I know you might be wondering what these are, these are coordinates of the point of the Mountain like longitude, latitude, and altitude.
Fun Fact: We got exactly 552 coordinates.
DataFrame['X'] = pd.Categorical(DataFrame['X'])Categorical is a pandas data-type and used to save memory space and speed up computation. you can convert using syntax pd.Categorical() with parameter DataFrame['X']
DataFrame['X'] = DataFrame['X'].cat.codesBy using cat.codes we get unique integer values for each value of X in an array in the position of the actual values even if the value is none then also returns a unique numeric value.
Suppose your data contains a column named Gender with 1000 rows which have only 2 types of values as Male and Female(both values are just repeated in rows). But for a computer there are 1000 unique values so it will treat every value as unique. To save memory we specify the similar set of values as category so that computers don't allocate memory every time it encounters that value, instead of that it will just assign a reference to the value.
fig = plt.figure(figsize=(6, 8))To create a figure window You can use this function plt.figure(), even we can set the figure size by using the figsize=(x,y) where x(inches), y(inches) is the width and height of the figure window and stored in fig.
ax = fig.gca(projection='3d')fig.gca() with argument as projection=3d`` returns the three-dimensional axes associated with the figure window and stored in the ax variable.
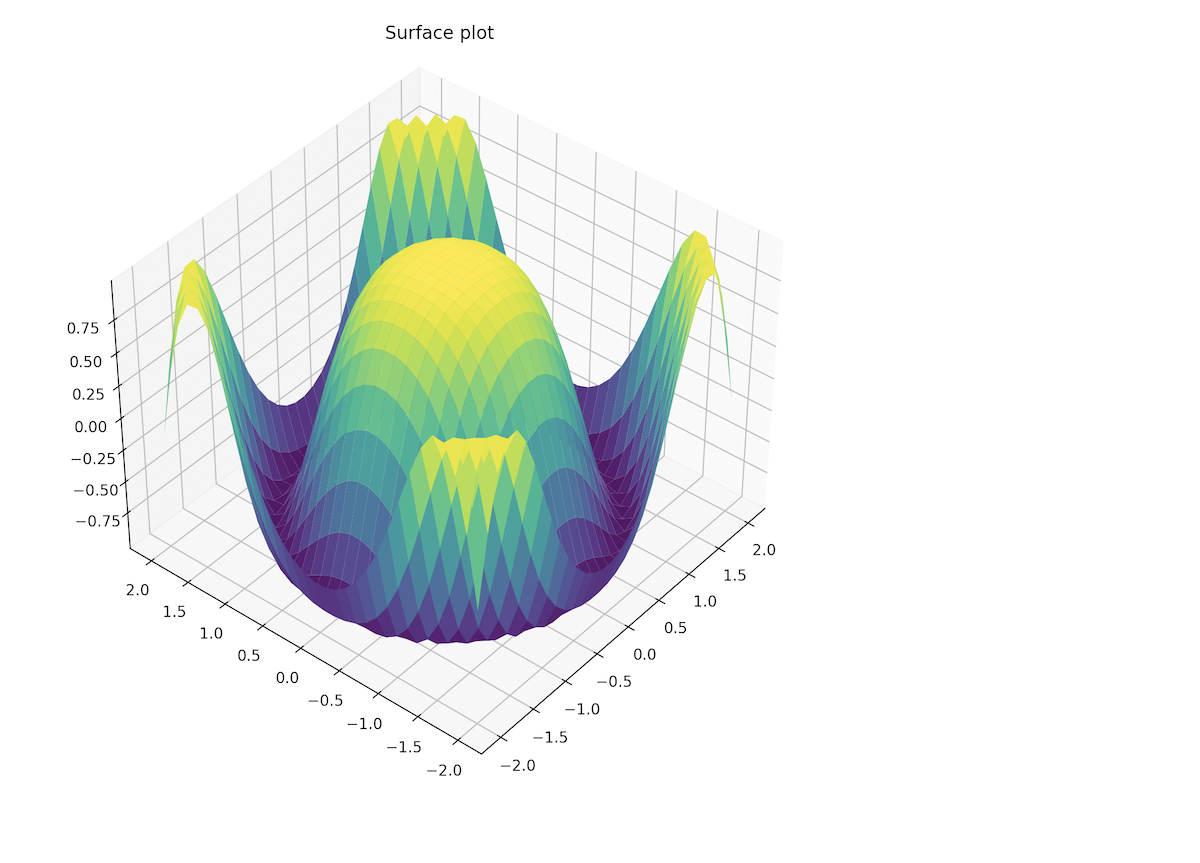
ax.plot_trisurf(DataFrame['X'], DataFrame['Y'], DataFrame['Z'], cmap=plt.cm.jet, linewidth=0.2)You're almost there! creating a three-dimensional plot with plotting function ax.plot_trisurf takes in x, y, and z values, cmap, and linewidth. where cmap defines the colormap of the plot, and linewidth makes the curves smoother.
cmap=plt.cm.jet used jet colormap, even you can use another colormap from below list, you need to replace the jet with colormap you want to use.
plt.title("San Mount Bruno")
plt.xlabel("x axis")
plt.ylabel("y axis")
plt.title function will add a title to Your plot, plot.xlabel and plot.ylabel adds labels to the x and y-axis of the plot.
plt.show()plt.show opens interactive windows that display your figure.
Source Code
import pandas as pd

import numpy as np

import matplotlib.pyplot as plt

from mpl_toolkits.mplot3d import Axes3D

DataFrame = pd.read_csv('mountain.csv')

DataFrame = DataFrame.unstack()

DataFrame = DataFrame.reset_index()

DataFrame.columns = ['X', 'Y', 'Z']

DataFrame['X'] = pd.Categorical(DataFrame['X'])

DataFrame['X'] = DataFrame['X'].cat.codes

fig = plt.figure()

ax = fig.gca(projection='3d')

ax.plot_trisurf(DataFrame['X'], DataFrame['Y'], DataFrame['Z'], cmap=plt.cm.jet, linewidth=0.2)

plt.title("San Mount Bruno")
plt.xlabel("x axis")
plt.ylabel("y axis")


plt.show()
You have completed the workshop, share with everyone, and Congratulations!!!

There are so many exciting things you can make now. For example, visualize datasets, and build things like 3D models. Now your turn to apply what you know to make more projects. Here's some inspiration on ways you can try new projects even cool!