Home
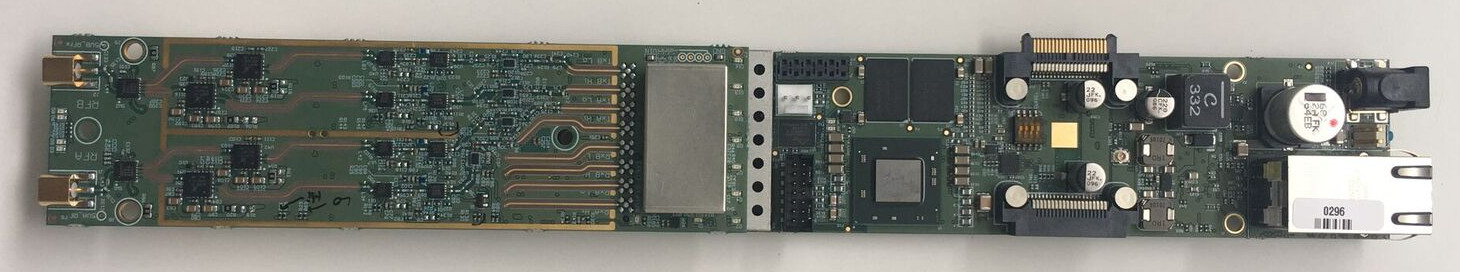
Demonstration projects for the Skylark Iris radio modules
- Main wiki for Iris driver support: https://github.com/skylarkwireless/sklk-soapyiris/wiki
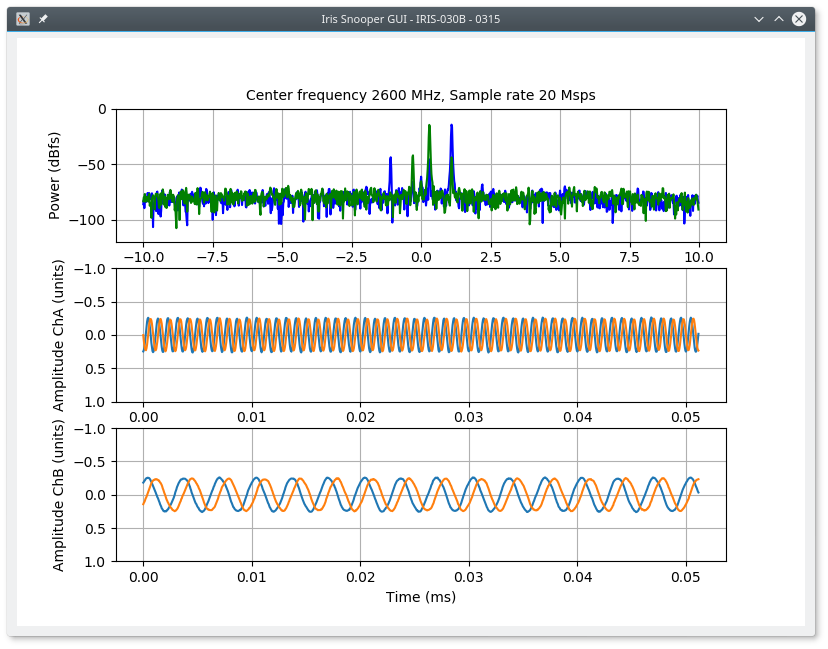
The Iris Snooper GUI plots live Rx frequency and time domain plots from the specified iris on the network. The captures will not disturb the currently running application, allowing for basic passive monitoring.
Requirements:
- SoapySDR with python3 bindings enabled
- SoapyIris driver installed
- numpy, matplotlib, scipy for python3
- pyqt5 for python3
Run the code:
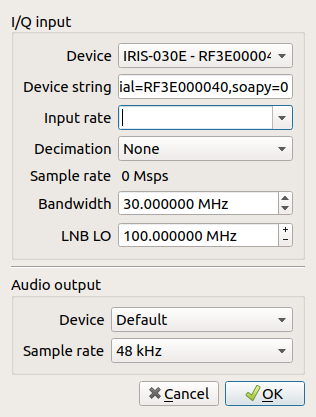
Command line options can be used, or a device selection dialog will appear:
sklk-demos/python/IrisSnooperGui.py
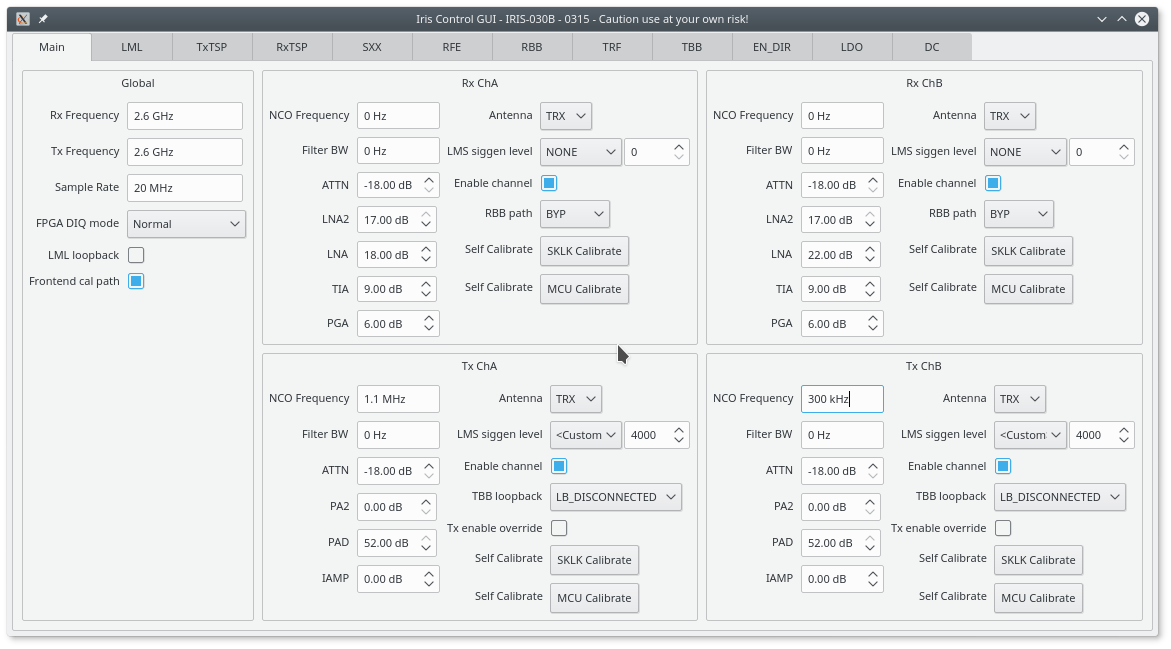
The Iris Control GUI provides a tabbed control panel for generic, advanced, and fine grained settings. The control panel can be used to view and tweak settings live while an Iris application is running.
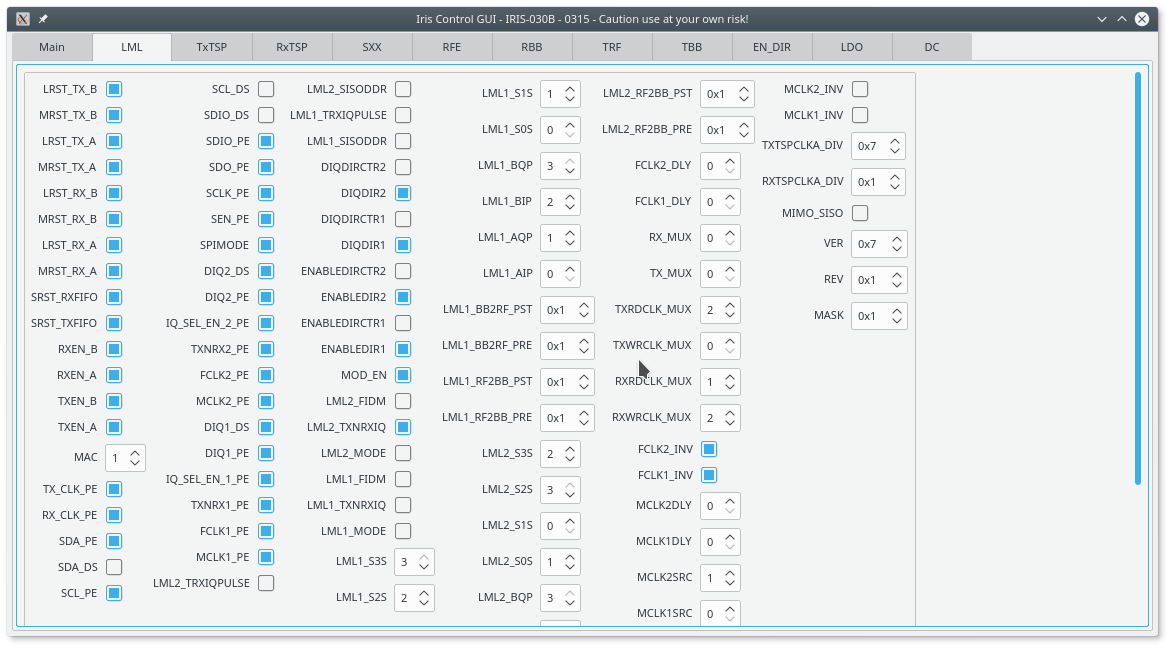
Advanced controls for LMS7 registers
Requirements:
- SoapySDR with python3 bindings enabled
- SoapyIris driver installed
- pyqt5 for python3
Run the code:
Command line options can be used, or a device selection dialog will appear:
sklk-demos/python/IrisControlGui.py
Demonstrate MIMO capability on 2+ Iris-030s connected to each other over the bus (sharing clocks and a trigger). Half of boards are designated as TX and send complex sines in a TDMA style. The other half of boards are RX and plot received signal (the sinusoids from each TX radio).
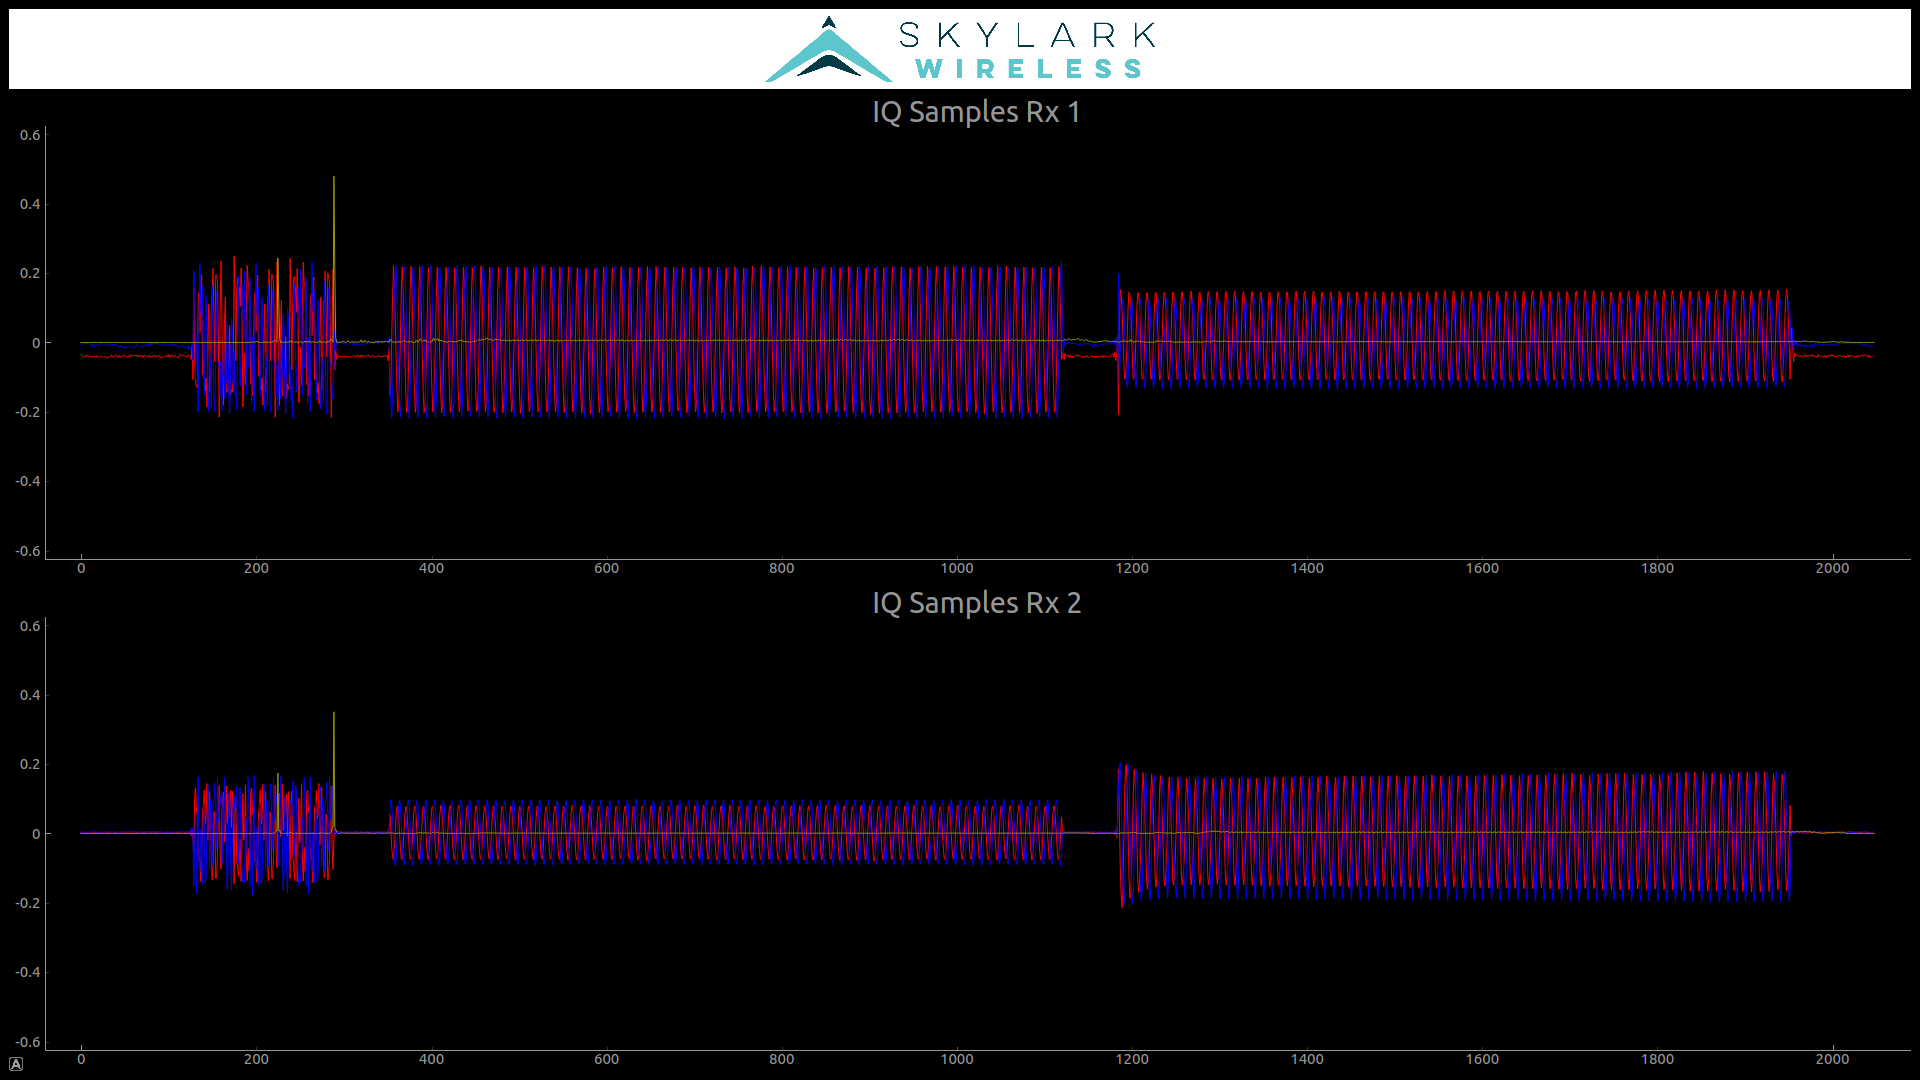
Run the code:
Command line options can be used to specify the Irises, frequency, sample rate, gains, etc.
--LTSMode uses one board, not in the array, to send an LTS followed by a sine wave (one from each antenna). Boards in an array receive on both antennas and align the signal to the LTS and display a plot per antenna.
--Constellation sends random QPSK modulation data and plots it on a scatter plot.
Use "f" to exit full screen mode, and "q" to quit (make sure graphic window is selected).
Requirements:
- SoapySDR with python3 bindings enabled
- SoapyIris driver installed
- pyqtgraph, numpy
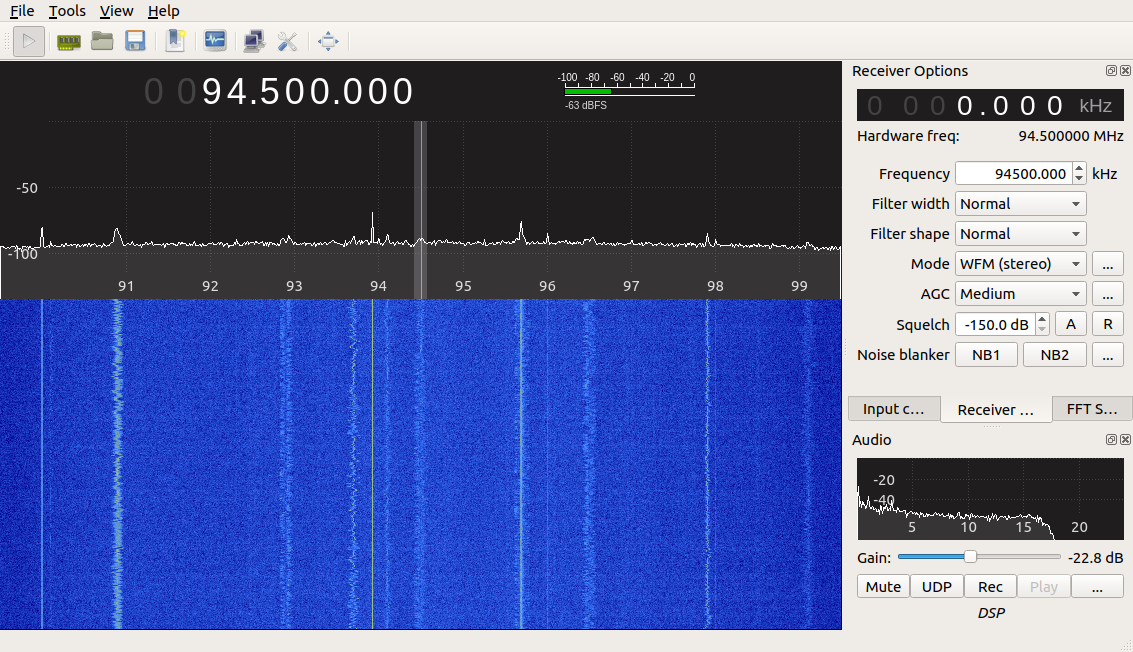
We provide an install script for [Gqrx](http://gqrx.dk/) on Ubuntu 18.04 here: https://github.com/skylarkwireless/sklk-demos/blob/master/scripts/install_gqrx.sh
Gqrx provides a receiver for AM, SSB, CW, FM-N and FM-W waveforms, as well as nice graphical spectrum analyzer.
There are many other open-source SDR projects that work with Soapy basically out of the box, some are listed here: