[GUI]Find reference bugs #1361
Comments
|
@xmhwws I can't reproduce issue with class skip. There are very few classes, so it decompiles quite fast for me: Does this issue happen every time? Also, issue with missing usage is not an issue, jadx just move field initialization from static constructor to field definition. public static String versionname;
static {
...
versionname = "tosversion";
...
} |
|
When I use
When I use
So this is an error due to insufficient memory available for jadx? But why are Log of all levels of BUG2: Can lookup references support this? Otherwise, it's a bit annoying to jump to the declaration every time. BUG3: Parent class: Searching for subclasses overriding the methods of the parent class, jadx lookup references are not supported? |


|
@xmhwws On of the disadvantages on Java is that it has it's own memory management system that works totally independent of the OS. Especially old Java versions were very greedy regarding their RAM usage, they were often using large parts of the assigned RAM even if not necessary, just to save a few invocations of the garbage collector. Therefore when starting a Java VM you have to specify the maximum Java heap size, which is done using the command-line |
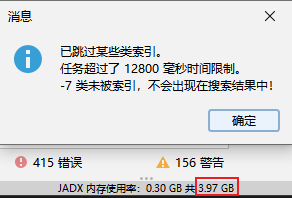
Definitely not. Actual memory usage is only 0.3 GB.
As for main issue, I found several flaws in current implementation:
I will try to fix these issues with top priority
Yes it possible to add definition here, but this feature called
Very similar to previous question. I can add also definitions of related(overridden) methods. But for now I am not sure how to better show them, options are:
Anyway, this is a lot of changes, maybe it is better to open separate issue for discussion 🤔 |
|
@xmhwws I commit several fixes for correct time counting and skipped classes message. Please check. |
jadx latest beta version
win10
apk link:https://drive.google.com/file/d/1wT9r9--VfqvsEghLLgiy0IDcfMSIYy2e/view?usp=sharing
When I drag in the apk, and the decompilation is finished, it gives me this message:
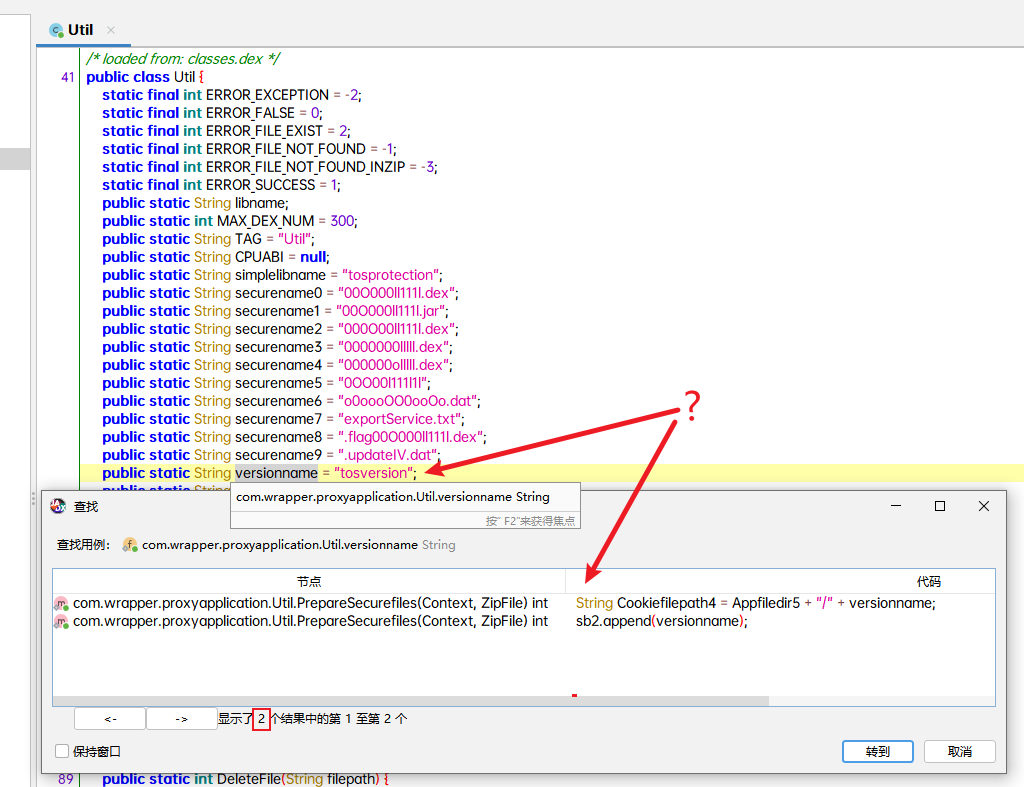
class:
com.wrapper.proxyapplication.UtilStatic member variable:
versionnameThe result of the search for references is only 2!
In Jeb:
The text was updated successfully, but these errors were encountered: