OpenVino Toolkit - Deploy People counter App at the Edge

| Details | |
|---|---|
| Programming Language | Python 3.8 |
| Intel® Distribution of OpenVINO™ toolkit | v2021.4.752 |
- What it does?
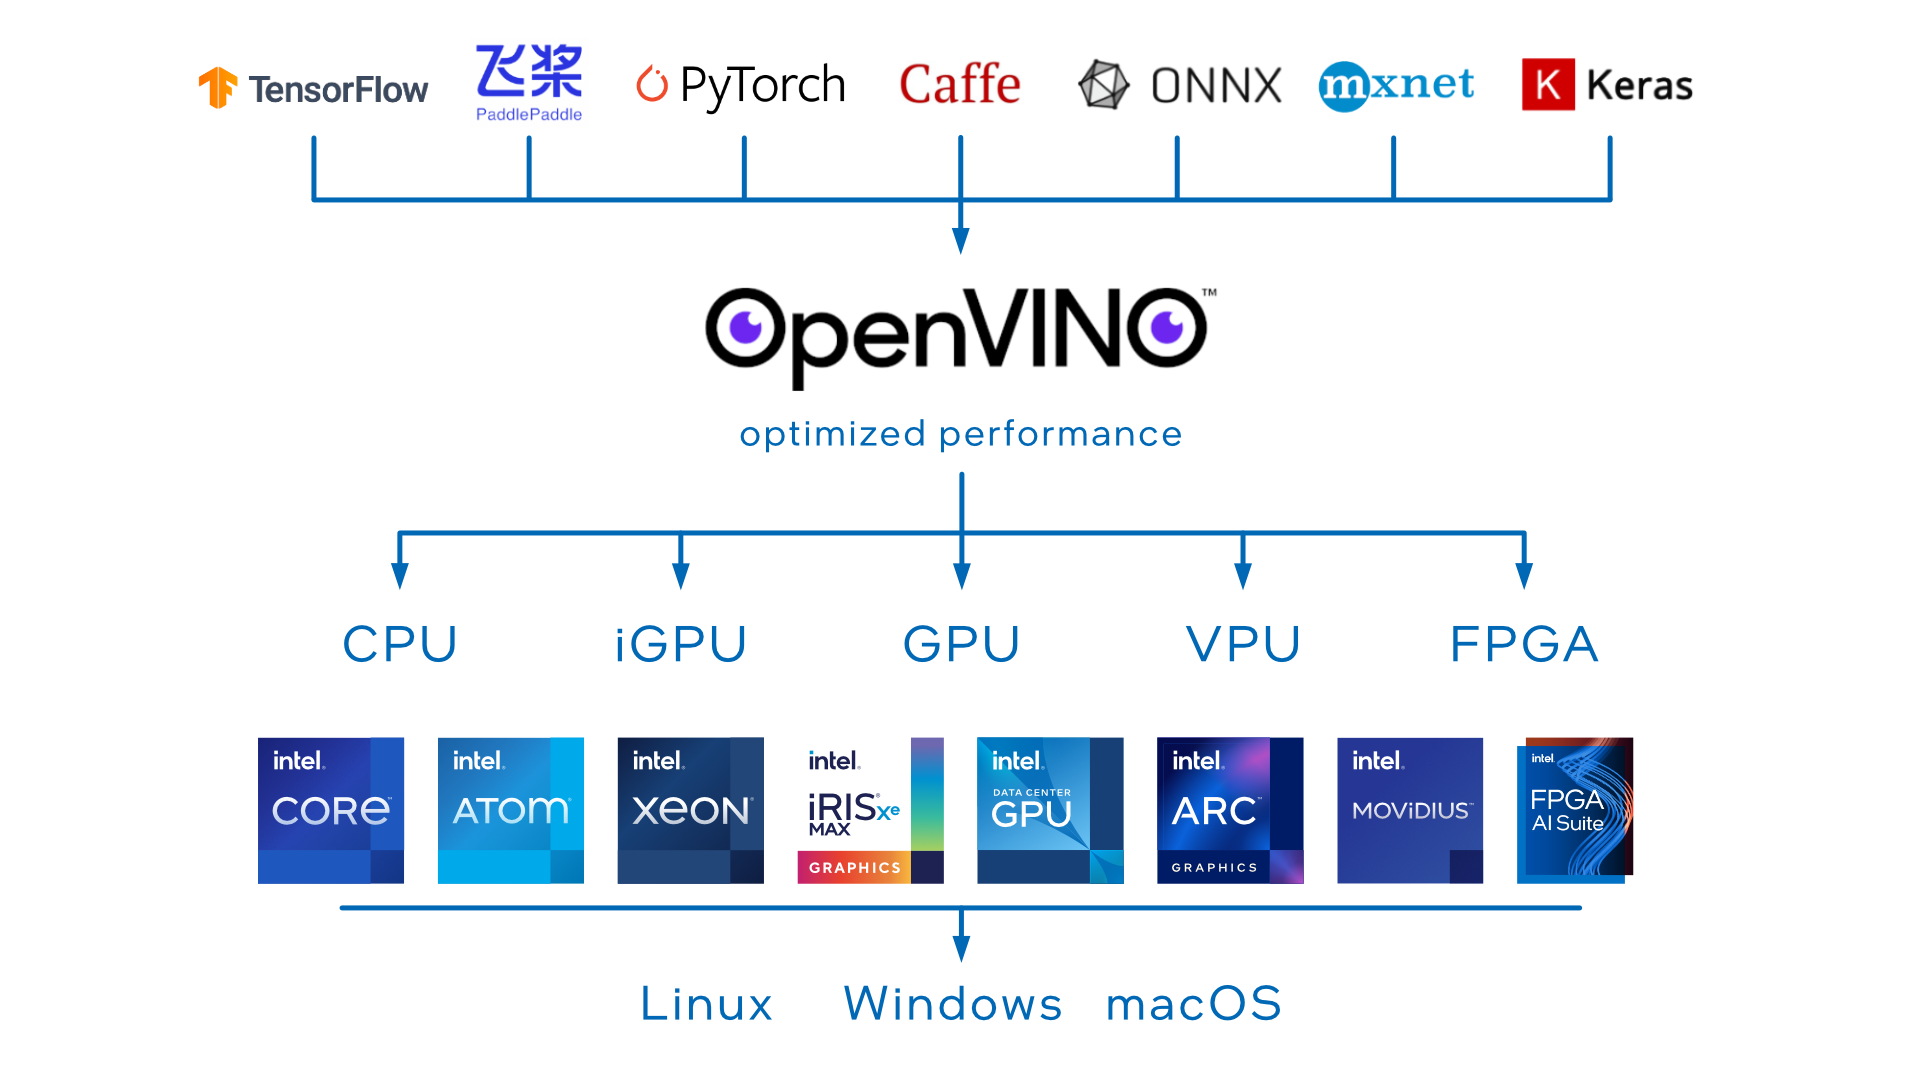
- What is OpenVINO™ Toolkit
- How it works?
- Run the application
- Where to find the components logs?
- Project writeup
- How to check the MQTT published messages?
- Further readings
The people counter application demonstrates how to create a smart video IoT solution using OpenVINO™ Toolkit. The app detects people in a designated area, providing the number of people in the frame, average duration of people in frame, and the total count. It also saves a copy of the streamed output and detection results to the local storage device.
A captured video of the people detection can be found here
The application consists of four components that need to run separately:
- MQTT Mosca server
- Node.js* Web server
- FFmpeg server (FFserver)
- Python backend application using OpenVINO™ Toolkit?

All the needed packages as well as the components are installed within a Docker image. That Docker image is using Intel® Distribution of OpenVINO™ toolkit Docker image for Ubuntu* 20.04 LTS as a base image.
OpenVino is a cross-platform deep learning toolkit developed by Intel. The name stands for "Open Visual Inference and Neural Network Optimization". It focuses on optimizing neural network inference with a write-once, deploy-anywhere approach for Intel hardware platforms.
- Build the Docker container In the top folder run the following command
docker build --network=host -t demo .Note: To configure the Docker image for GPU, you need to add thne build argument DEVICE as follows
docker build --network=host --build-arg DEVICE=GPU -t demo .- Run the Docker container of the demo Start the container
docker run -dit --rm --name demo \
    -p 3000:3000 -p 3002:3002 -p 3004:3004 demo
For code debugging you could attash a volume with the code to the container using
docker run -dit --rm --name demo  -v $PWD:/home/openvino/people-counter \
    -p 3000:3000 -p 3002:3002 -p 3004:3004 demo
Run a bash terminal inside the container
docker exec -it demo bashThen, to run the demo of the application execute the following command within the container bash
cd scripts && ./run_demo.sh
The web application will be then reachable via http://localhost:3000/ after a few seconds of running the script
The settings of the demo can be changed by adapting the parameters passed to main.py in run_demo.sh script. The available options are listed below
usage: main.py [-h] -m MODEL -i INPUT -n NAME -dt DATA_TYPE [-d DEVICE] [-pt PROB_THRESHOLD] [-db]

optional arguments:
  -h, --help            show this help message and exit
  -m MODEL, --model MODEL
                        Path to an xml file with a trained model.
  -i INPUT, --input INPUT
                        Path to image or video file
  -n NAME, --name NAME  Model name: needed for performance export.
  -dt DATA_TYPE, --data_type DATA_TYPE
                        Floating-point precision e.g. FP32
  -d DEVICE, --device DEVICE
                        Specify the target device to infer on: CPU, GPU, FPGA or MYRIAD is acceptable. Sample will look for a suitable plugin for device specified (CPU by default)
  -pt PROB_THRESHOLD, --prob_threshold PROB_THRESHOLD
                        Probability threshold for detections filtering(0.5 by default)
-db, --debug Set to use the app in debug mode.(False by default)The model performance (.json file) as well as a video capture of the demo (.avi file) are exported to the local folder perf. The format of the model performance file looks as below
{
    "Model Name": "person-detection-retail-0013",
    "People count": 30,
    "AVG inference time (sec.)": 0.022,
    "Completion Time (Sec.)": 137.503,
    "Detection confidence threshold (%)": 80.0,
    "Floating-point precision": "FP32"
}In order to run the application for various models and compare their performance, you execute the script test_models.sh <DEVICE> <FLOATING_POINT_PRECISION> located in the top folder of the project. That will execute the app for each of the models listed below and export the corresponding results inside the running container under the folder /home/openvino/app-artifacts/perf.
Usage: ./test_models.sh <DEVICE> [Floating-point precision: FP16|FP32]
e.g: ./test_models.sh CPU FP16The logs of each of the components are available under the folder logs
|____webservice-ui.err
|____mqtt-server.err
|____mqtt-server.out
|____webservice-ui.out
|____ffserver.err
|____people_counter.log
|____ffserver.outMore details about the project and the model selection can be found here
To check the MQTT published messages you can use mqtt-explorer tool.
First, you need to run the following commands according to the Operating System you have.
- For MacOS:
brew install --cask mqtt-explorer- For Ubuntu OS
sudo apt update
sudo apt install snapd
sudo snap install mqtt-explorer
Note: Make sure to have the port number 3002 exposed withing the Docker image. That should also be mapped to the host port number 3002 when running the container -p 3002:3002
In mqtt-explorer connect the client to ws://localhost:3002
