-
Notifications
You must be signed in to change notification settings - Fork 51
WorkloadViewer
WorkloadViewer is a GUI tool to analyze the data collected by the WorkloadAnalysisTarget in a SQL Server database. It shows metrics about the workload, relative to the beginning of the capture (in minutes).
When WorkloadViewer loads it shows a connection dialog where you can enter connection information for the baseline and benchmark data.
You can also specify the same information from the command line:
-F or --File                Path to the .json configuration file that contains all
                            the other connection properties
-L or --Log                 Path to the log file
-S or --BaselineServer      Name of the SQL Server where the baseline data lives
-D or --BaselineDatabase    Name of the database where the baseline data lives
-M or --BaselineSchema      Name of the schema where the baseline data lives
-U or --BaselineUsername    User name to connect to the baseline database
-P or --BaselinePassword    Password to connect to the baseline database
                            Omit username and password to connect with Windows Authentication
-T or --BenchmarkServer     Name of the SQL Server where the benchmark data lives
-E or --BenchmarkDatabase   Name of the database where the benchmark data lives
-N or --BenchmarkSchema     Name of the schema where the benchmark data lives
-V or --BenchmarkUsername   User name to connect to the benchmark database
-Q or --BenchmarkPassword   Password to connect to the benchmark database
                            Omit username and password to connect with Windows Authentication
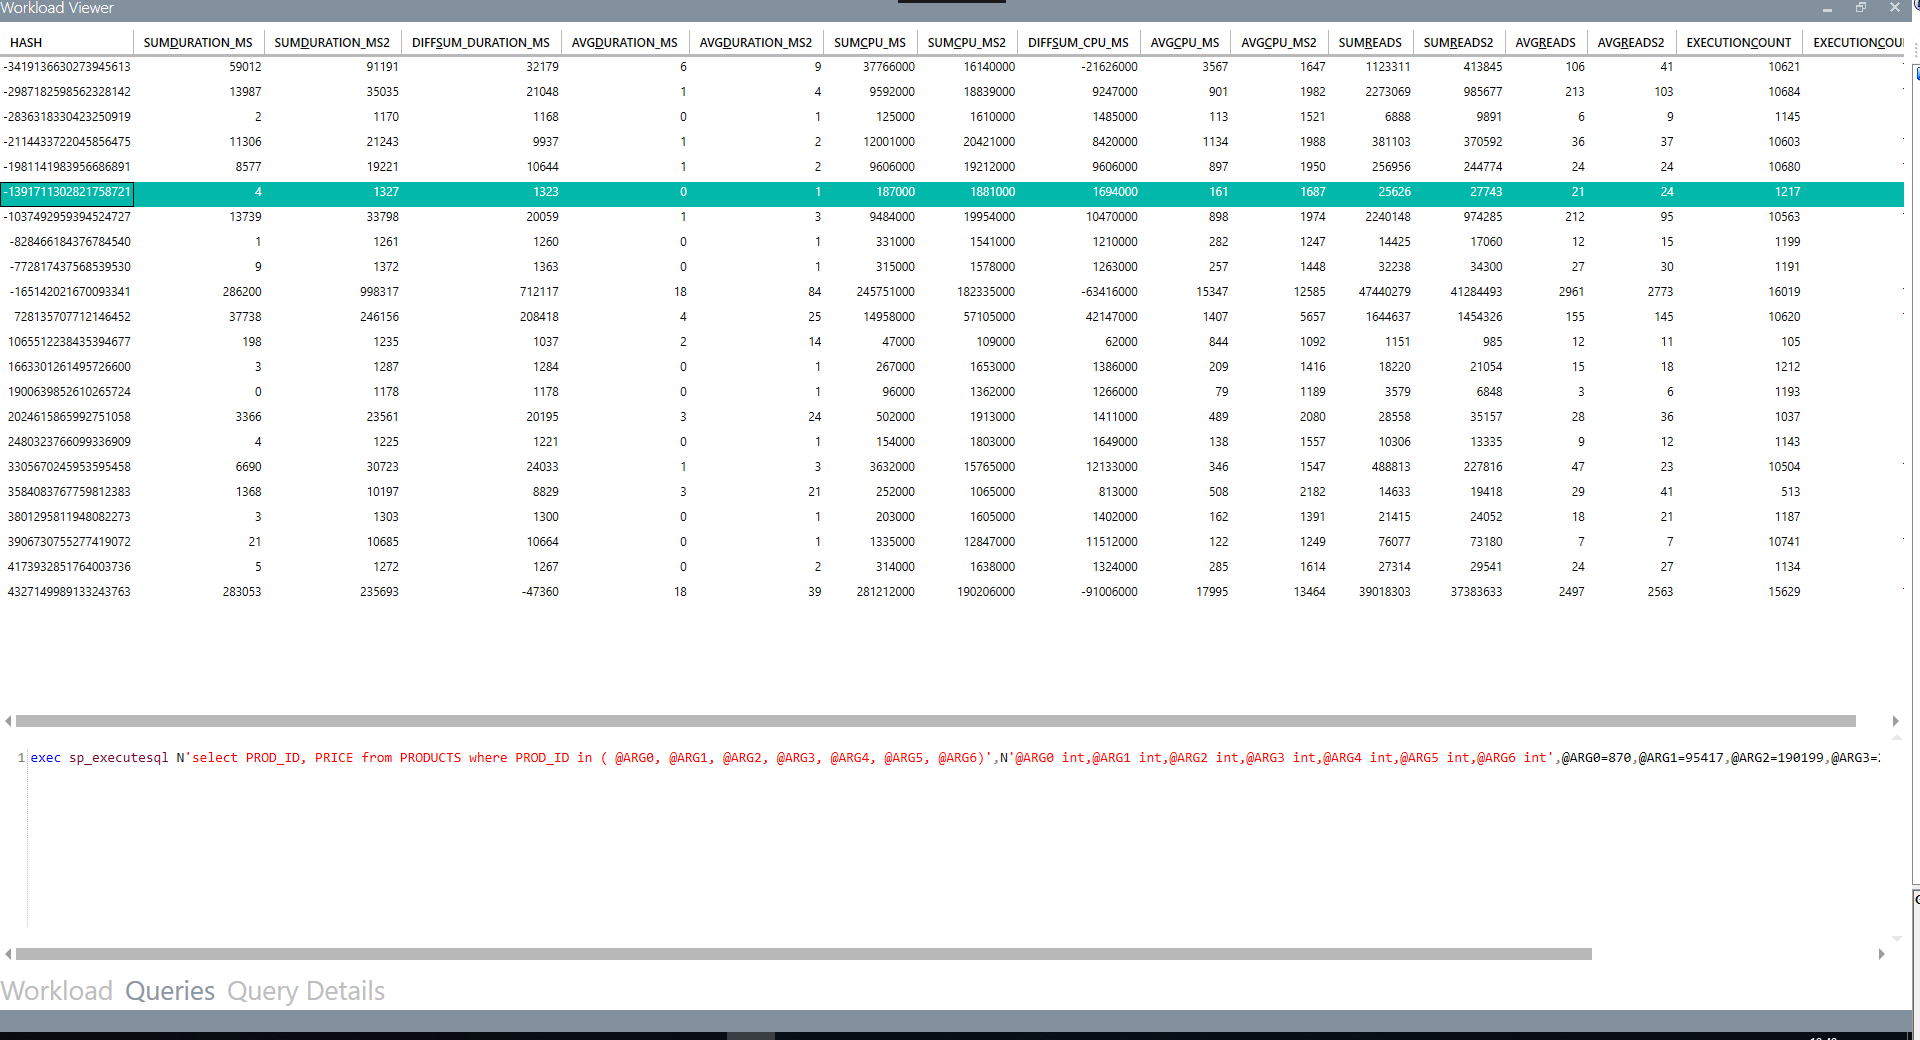
The main window of WorkloadViewer is divided in three tabs:
The three charts in the "Workload" tab show an overview of the workload analysis: CPU, Duration and Batches/sec. Two workloads can be compared by displaying independent series (Baseline and Benchmark) for each workload.

This tab displays information about the queries and how they relate to the workload. For a single workload analysis, it shows the most expensive queries. When comparing two workloads, it can be used to identify query regressions.

Double clicking a query in the "Queries" tab takes you to the "Query Details" tab, where you can see the text of the selected query, specific statistics by application, database, host and login and the average duration in a chart.
