Introduction and working with local projects
Well known from previous generations of the Spring Tool Suite, the Spring Tool Suite 4 also contains the boot dashboard for quickly running, re-starting, tagging, and inspecting Spring Boot projects in your workspace.
Please note, that this documentation applies to Eclipse only. There is however also a similar (but simplified) Vscode extension provided by Microsoft.
Spring Boot is now a widely adopted technology to simplify your life when implementing Spring applications for the enterprise. Especially suitable for creating microservice-based applications, it has changed the way we think about small and easy to configure Spring applications dramatically. Together with Spring Cloud, it opens the door to truly cloud-native applications, composed out of probably many microservices. This creates a need for developers to be able to easily work with not just one, but many Boot applications simultaneously in their IDE.
This realization was the starting point for the Spring Boot Dashboard. Its focus is to help you deal with a potentially larger number of Spring-Boot-based microservice applications and make your life as a developer a lot easier when working on those projects in your IDE.
The Spring Boot Dashboard comes as an additional view in STS/Eclipse. It is opened automatically in the Java perspective. You can also open it by pressing the Spring Boot button in your main toolbar. It opens up a simple view that is in sync with your workspace projects, showing those projects of your workspace that are Spring Boot projects.

The main purpose of the Boot Dashboard is to give you quick access to the things you do every day, every hour, or even more frequently. You can quickly start your boot apps (in run or debug mode) by selecting them in the boot dashboard and pressing the "run" or "debug" action in the toolbar. There is no faster way to launch your boot app than this. And since you probably are going to change code and want to restart your app, the action lets you restart your boot app, if it is already running. Change your code, press the "run" button in the boot dashboard, and your boot app gets stopped and restarted for you. Again, a simple one-click action.

The great thing about these actions (and many more) in the boot dashboard is that they operate on single or multiple projects at the same time. If you want to start or stop a bunch of boot apps at the same time, for example to startup a set of collaborating services, just select them all in the dashboard and press "run". That's it.

As soon as your boot app is being started, the boot dashboard visualizes that the app is starting - and it distinguishes between its startup phase (the VM is running, but the app is still initializing) and it is truly running and ready to use. The progress icon indicates the app is still starting up, the green "up" icon shows up as soon as the app is fully initialized and running. You don't need to observe the log output until some "server started" message shows up or something like that. The boot dashboards icons will let you know.
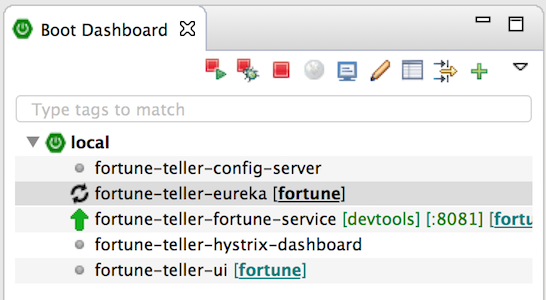
Once the app is running, the port that it listens is displayed - for your convenience. You don't have to scan the log output anymore to find out what port is being used by the app. The dashboard displays that information automatically. And in case you would like to jump to the console output of a running boot app, there is a quick action for that as well.
Often there is no need anymore to know about the port of a running app - since you don't have to open a browser tab for the app yourself. Double-click on the project in the boot dashboard and it will open a new browser tab for you - directly navigating to the apps default URL.

By default, this opens an Eclipse/STS internal browser view. If you prefer to use an external browser, you can set this in the preferences.
By default, double-click will open the root url path '/' on your app. If this is not what you want, you can customize that. Open the properties view, select the project in the boot dashboard and enter the default URL extension that you prefer. The double-click will open the default URL of the app + your customized extension to it.

In case you are not sure what URL extensions your application defines, you can select the “Request Mappings” tab in the properties view. All the request mappings of the running app are listed - your self-defined ones at the top, the ones coming from libraries at the bottom of that list. Double-clicking on the URL extension opens a browser for that extension, double-clicking on the code pointer opens the corresponding file of your project in an editor and jumps to the line that defines the request mapping.

The more microservice projects you have in your workspace, the more likely it is that you don’t work on all of them at the same time. You would like to focus on a subset. In Eclipse/STS, you might have created a working set, for example. The boot dashboard allows you to tag projects with an arbitrary number of tags (again, in the properties view). Those tags can then be used in the filter box (at the top of the boot dashboard) to reduce the number of projects that show up in the boot dashboard.

Since STS 3.7.3 the Boot Dashboard supports multiple launch configurations per project. If a project has more than one associated launch config, then they will automatically show up as children of the project's node in the tree.

All the features of the boot dashboard work for those individual launch configs, as well as selections of them, in the ways you would expect. For examle, you can start/debug/stop them, either individually or in groups. You can jump to the associated console view, open a browser window for that running application, set a default path per launch config (in case you want to have different default path settings for your launch configs), tag them, and so on.
The project node in the dashboard also functions as a shortcut for all its children. It displays a quick summary of the individual launch configs and allows you to execute bulk actions on them, like start or stop them all at once.
To reduce clutter and to maintain the simplicity of the UI for the common case where there's just one launch configuration per-project, a 'Hide Solitary Launch Configurations' filter is applied to the Dashboard by default, but you can disable this filter if you wish:

A single configuration is created automatically when an app is launched. To help you deal with multiple launch configs for a project, the context menu provides some actions that allow you: to quickly open a launch config editor; to duplicate an existing launch config; or to delete one.

Tip: If you want to run multple instances of a single local app simultaneously (e.g. you want to bind multiple local instances of a service via Eureka), you can set the property server.port=0 to let spring-boot pick a port dynamically (otherwise all but one of your launches will fail because the port is already bound).
Nevertheless there might be some launch configs in your workspace that you do not like to see in the boot dashboard. For this case the Spring Boot launch config provides an option that hides it.
