feature request: allow changing the labels of the legends #75
Comments
|
Thanks for opening the issue. This is officially on the to-do list now!
…On Wed, Mar 1, 2017 at 6:19 AM silberzwiebel ***@***.***> wrote:
This is an idea that came up in the discussion of #73
<#73>
The point is to let users change the labels of the legend in bayesplot
objects easily, possibly by setting them as arguments in the plot creation.
This could for instance be helpful to plot the pp_check for two models and
then label y_rep as model Aor model B, respectively.
I mainly used pp_check() until now but I guess this might be usable for
other plotting possibilites as well.
@jgabry <https://github.com/jgabry> wrote in #73
<#73>:
But another option would be to add additional arguments to all of the
bayesplot plotting functions so that user's can specify the names to be
used in the legend at the same time they create the plot. For example, it
could look something like this maybe:
my_legend <- list(y = "emp. data", yrep = "model predict.")
ppc_bars(y, yrep, ..., legend_labels = my_legend)
That way the legends could be created with those labels instead of having
to change them after the fact. I'd need to figure out the best way to
implement that (it would vary depending on the plotting function) but that
should be much easier to do.
—
You are receiving this because you were mentioned.
Reply to this email directly, view it on GitHub
<#75>, or mute the thread
<https://github.com/notifications/unsubscribe-auth/AHb4Q1AGq624obkz8xvzoh0kQxBAUJ_eks5rhVRFgaJpZM4MPhxq>
.
|
|
Just stumbling over this again. The work-around for changing the text of the legend still works but now I wanted to change the text of facet strings. In my concrete example I want to contrast the outcome for a boolean factor and I'm just seeing "TRUE" and "FALSE" as facet labels. However, manual context-sensitive strings would be way more intuitive for the plot. |
|
@silberzwiebel Thanks for following up on this! I would much rather add helper functions for this to modify these things after the plot is created (e.g., like these other ones we have for stuff like changing axis titles) than add many more arguments to the plotting functions, but as far as I know it's not possible to change the legend or facet labels after the fact. @tjmahr Any clever ideas in this regard? Do you know of a way to edit the created ggplot object to change this stuff (maybe messing with In other words, if we can allow this by adding a few helper functions it would be so much better than having to add code for this to each of the plotting functions individually. |
|
Helper functions sound great.
This happens after the plot is already built (and works fine), so it could go into a helper function. But I'm entirely unsure and unexperienced whether these scales are "stable" in the sense that they will always correspond to the legend and whether it is possible to change other strings like the facet labels in this way. |
Yeah, what's tricky about that is the order of but my hunch is that Regarding the facet labels, can you give more details about what you want to do? It should actually already be possible to change the facet labels for many of the plotting functions, but you have to use a ggplot # simulate some data
f <- function(N) {
sample(1:4, size = N, replace = TRUE, prob = c(0.25, 0.4, 0.1, 0.25))
}
y <- f(100)
yrep <- t(replicate(500, f(100)))
dim(yrep)
group <- gl(2, 50, length = 100, labels = c("GroupA", "GroupB"))
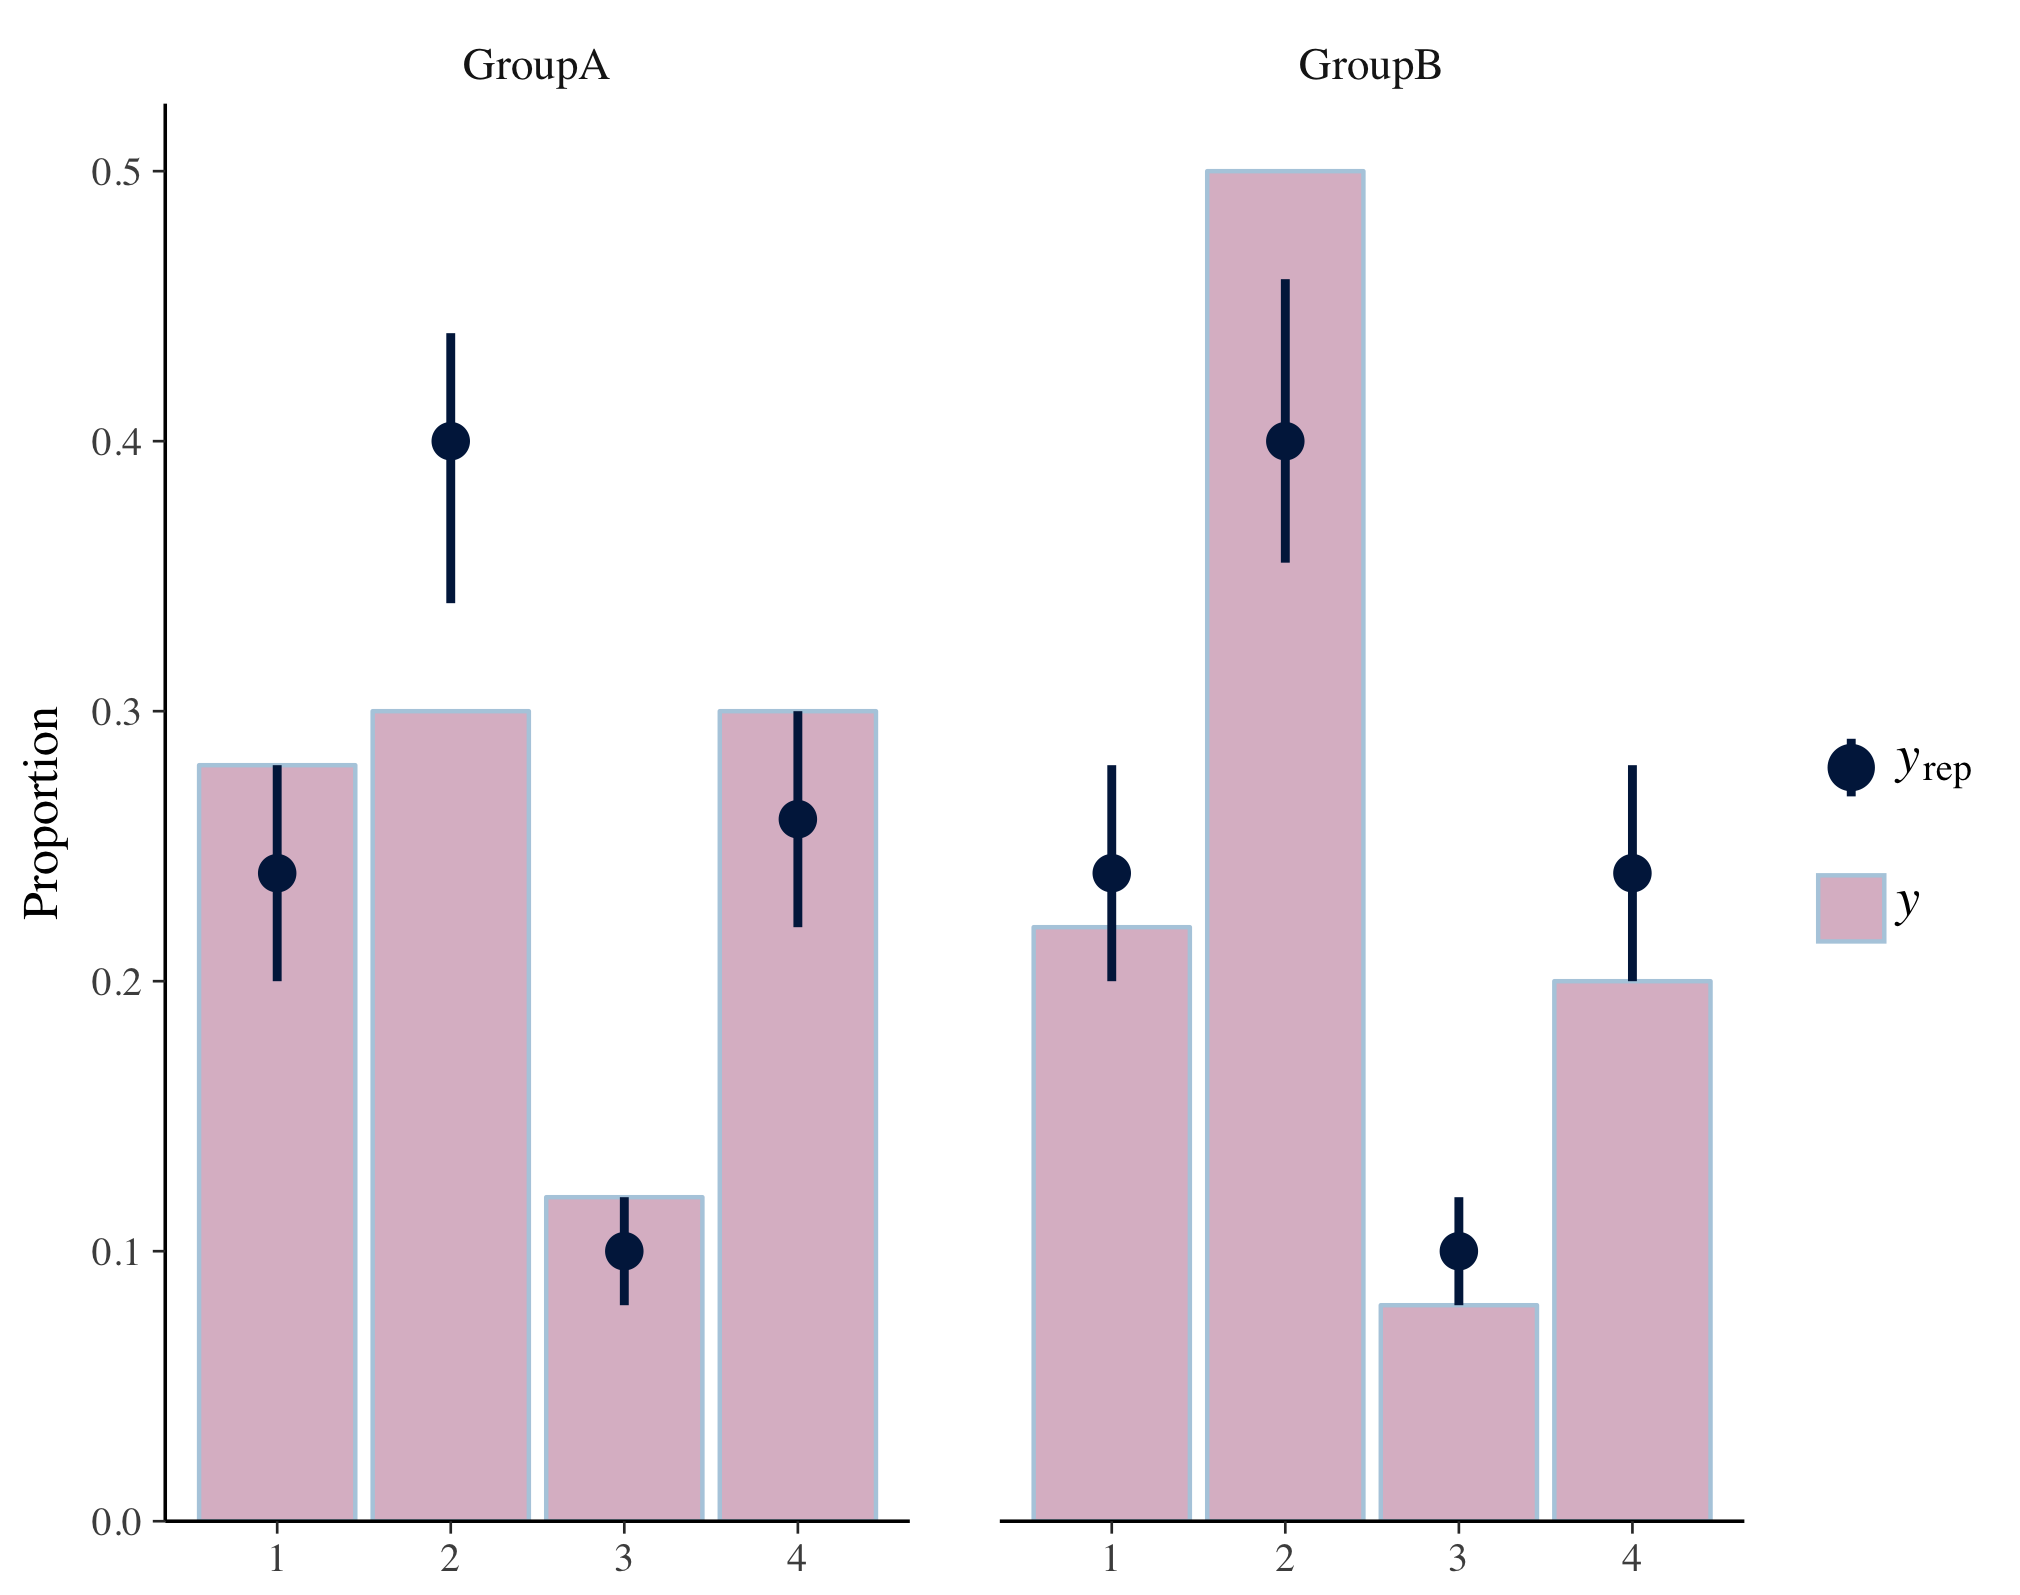
# facet labels default to labels of 'group' (in this case GroupA, GroupB)
p <- ppc_bars_grouped(y, yrep, group, prob = 0.5, freq = FALSE)
plot(p)
Now we can change the facet labels to "Banana" and "Turtle" instead of "GroupA" and "GroupB": my_labels <- as_labeller(c("GroupA" = "Banana", "GroupB" = "Turtle"))
p + facet_wrap("group", labeller = my_labels)
|

|
Wow, thanks, changing facet labels like this works fine! I had some trouble because my grouping variable has a different name than |
|
Not too ignorant! It’s not currently in any examples anywhere, but it would
be a welcome addition. For this we could also add a `facet_relabel` helper
function.
…On Mon, Apr 16, 2018 at 4:21 AM kartoffelsalat ***@***.***> wrote:
Wow, thanks, changing facet labels like this works fine! I had some
trouble because my grouping variable has a different name than group but
still the first argument of facet_wrap("group", labeller = my_labels)
needs to be "group", otherwise ggplot2 will complain. Apart from that:
Thanks for the ggplot2 support :)
Is there already a hint to this approach somewhere in bayesplot's
documentation and I was too ignorant to find it?
—
You are receiving this because you were mentioned.
Reply to this email directly, view it on GitHub
<#75 (comment)>,
or mute the thread
<https://github.com/notifications/unsubscribe-auth/AHb4Q2t97_YWsgg5RMamrlIrQCMu4vyHks5tpFSKgaJpZM4MPhxq>
.
|
|
If you point me to an appropriate location in an appropriate file, I
could write some examples lines on how to change the facet labels
(although you might be quicker in doing this yourself -- doesn't matter
to me).
|
|
Right now there’s not one place to put it that makes sense since it applies to any of the ones with facets. It probably makes sense to add a https://github.com/stan-dev/bayesplot/blob/master/R/bayesplot-helpers.R How about I do the function and then you can add an example you like to the doc? I could easily add the example, but I like encouraging users to contribute! Maybe you’ll be more likely to suggest another useful addition in the future ;) |
|
Sounds great!
|
|
@silberzwiebel I just pushed a branch called I added one example using bayesplot/R/bayesplot-helpers.R Line 236 in 6b86e13 To add the example you can fork the bayesplot repo, switch to the |
For this case, I would suggest using a ggplot(iris) +
aes(x = Sepal.Length, y = Sepal.Width, color = Species) +
geom_point() +
scale_color_discrete(
labels = c(
# old_name = "new name"
setosa = "SETOSA",
versicolor = "VERSICOLOR",
virginica = "VIRGINICA")) |
|
Hah, thanks @tjmahr! Seems obvious in hindsight (especially since I used
that method inside of bayesplot) but totally slipped my mind.
…On Thu, Apr 19, 2018 at 9:21 AM TJ Mahr ***@***.***> wrote:
Helper functions sound great.
What you wrote the other year for changing the legend strings was:
p$scales$scales[[1]]$labels <- "emp. data"
p$scales$scales[[2]]$labels <- "model predict."
This happens after the plot is already built (and works fine), so it could
go into a helper function.
For this case, I would suggest using a scale_ function from ggplot2. The
example below I update the labels from the color scale:
ggplot(iris) +
  aes(x = Sepal.Length, y = Sepal.Width, color = Species) +
  geom_point() +
  scale_color_discrete(
    labels = c(
      # old_name = "new name"
      setosa = "SETOSA",
      versicolor = "VERSICOLOR",
      virginica = "VIRGINICA"))
—
You are receiving this because you were mentioned.
Reply to this email directly, view it on GitHub
<#75 (comment)>,
or mute the thread
<https://github.com/notifications/unsubscribe-auth/AHb4Q1xXfv-A9PFczihemhQeIzGpLigwks5tqI9GgaJpZM4MPhxq>
.
|
|
@jgabry just to let you know that this is still on my list, I' just busy doing other stuff right now (as always ;)). |
|
Thanks, no rush! |
|
@silberzwiebel I was going through open issues and just noticed I hadn't merged your PR (I could have sworn I did that months ago!). So I just finally merged your PR into my |
|
Thanks! Actually, I was the one who delayed this by months. I opened the PR just at the end of August, so you did all fine. |
This is an idea that came up in the discussion of #73
The point is to let users change the labels of the legend in bayesplot objects easily, possibly by setting them as arguments in the plot creation. This could for instance be helpful to plot the pp_check for two models and then label
y_repasmodel Aormodel B, respectively.I mainly used
pp_check()until now but I guess this might be usable for other plotting possibilites as well.@jgabry wrote in #73:
The text was updated successfully, but these errors were encountered: