![]()

IDE Perf: Performance diagnostics for IntelliJ Platform
This is a plugin for IntelliJ-based IDEs that gives real-time insight into the performance of the IDE itself. You can install it from the JetBrains Plugin Repository, then see the user guide for usage instructions. Feel free to file an issue if you find a bug or have a feature request. Note: this is not an officially supported Google product.
-
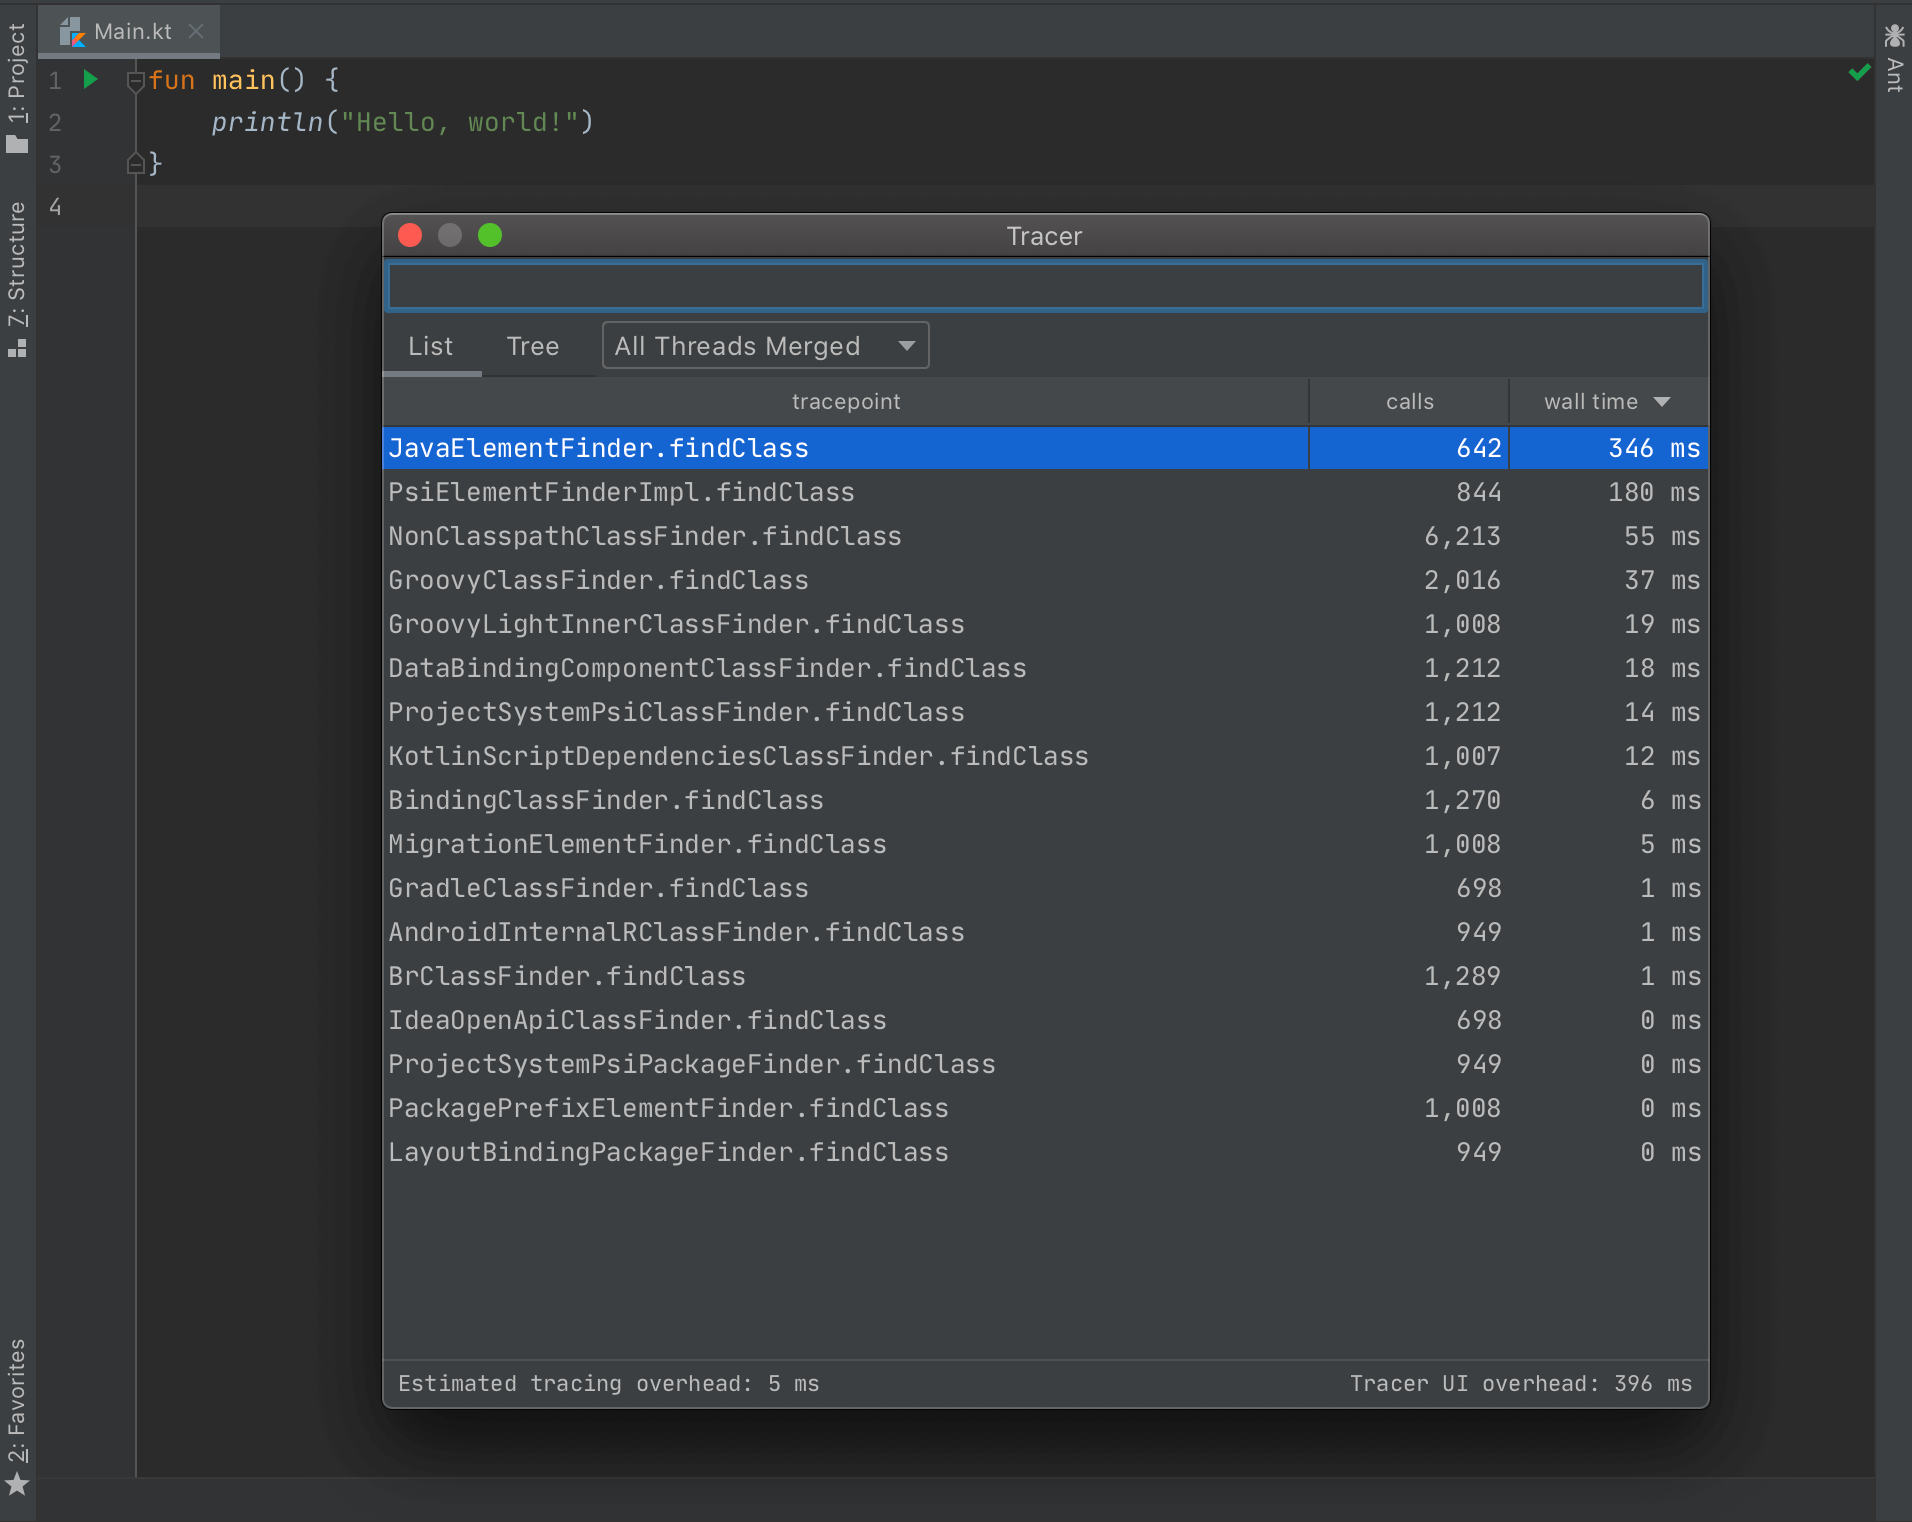
Method tracer: choose some methods, then get call counts and overhead measurements in real time as the IDE is being used. Methods are traced on-the-fly using bytecode instrumentation. There is both a method list view and a call tree view. Tracing commands are auto-completed as you type. Tracing overhead is low (approx. 200 ns per call).
-
Parameter tracer: track how many times a method is called with a specific argument. For example, you can trace the first parameter of
JavaPsiFacade.findClassto visualize class search queries. -
CachedValue tracer: track
CachedValuehit ratios in real time.
Here is a screenshot of the method tracer:
A batch profiler such as YourKit is still the first tool you should reach for when diagnosing an unknown performance issue. However, IDE Perf is useful when you want to dig deeper into a specific issue.
-
IDE Perf displays data in real time. This is useful in user-interactive scenarios because you will notice patterns in the way the data changes in response to specific user actions.
-
Tracing is targeted at only a small set of methods that you care about. This leads to low tracing overhead, accurate time measurements, and low visual clutter when looking at the call tree.
-
IDE Perf can surface IntelliJ-specific diagnostics such as
CachedValuestatistics.
-
Use the tracer to get call counts when CPU sampling is insufficient.
-
Use the tracer to accurately measure the effect of a performance optimization.
-
Use wildcard tracing to audit a new feature and look for unexpected overhead.
-
Given a user-reported performance bug, search for repro scenarios by tracing suspect methods and then monitoring the tracing data while trying out a variety of user interactions.
See dev-guide.md for development tips, and see CONTRIBUTING.md before submitting a pull request. If you plan to make any large-scale changes, it is a good idea to start a discussion first! If you need ideas on what to implement, check out the "future work" discussion here.