Skip to content
New issue

Have a question about this project? Sign up for a free GitHub account to open an issue and contact its maintainers and the community.

By clicking “Sign up for GitHub”, you agree to our terms of service and privacy statement. We’ll occasionally send you account related emails.

Already on GitHub? Sign in to your account

Using margin to adjust legend.text? #1502

Closed
Henrik-P opened this issue Jan 17, 2016 · 8 comments
Closed

Using margin to adjust legend.text? #1502

Henrik-P opened this issue Jan 17, 2016 · 8 comments
Labels
bug an unexpected problem or unintended behavior

Comments

@Henrik-P
Copy link

In issue #1435 on adjusting element_text, we find that "vjust and hjust no longer work. Instead, use the margin() parameter of element_text()". Does this apply also for legend.text?

I have a plot in which I want to adjust the legend.text horizontally.

df <- data.frame(x = c("a", "b"), y = 1)

p <- ggplot(df, aes(x = x, y = y, fill = x)) +
   geom_bar(stat = "identity") +
   ggtitle("My plot")
p

I followed the suggestion in #1435: "if you're having problems understanding the layout, try debug = TRUE":

p + theme(text = element_text(debug = TRUE))

I am not entirely sure I interpret the "debugging plot" correctly, but I thought it indicated all text elements which could be adjusted. Here, areas corresponding to axis.text, axis.title, and plot.title, are highlighted, but seemingly not those for legend.text (nor for legend.title).

I have tried to "push" and "pull" the legend.text horizontally using

p + theme(legend.text = element_text(margin = margin(l =  , r =  )))

...with various combinations of l and r, to no avail.

Thus my question: is legend.text (and legend.title) not included among the element_text elements which can be adjusted using margin? Which is the current ''official' way to adjust these elements?

@hadley
Copy link
Member

hadley commented Jan 25, 2016

Hmmm, this looks like an oversight - I seem to be doing something special for legends so they follow the usual process to get a titleGrob()

@hadley hadley added the bug an unexpected problem or unintended behavior label Jan 25, 2016
@hadley hadley added this to the v2.1.0 milestone Jan 25, 2016
@hadley hadley closed this as completed in 7be4c89 Jan 31, 2016
hadley added a commit that referenced this issue Feb 3, 2016
Tweak code style a bit so its easier to read.
@hadley hadley reopened this Feb 3, 2016
@hadley
Copy link
Member

hadley commented Feb 3, 2016

Re-opening - because of the way the way themes, legends, and margins interact, this is going to require considerably more thought.

@hadley
Copy link
Member

hadley commented Oct 30, 2017

Deleting the comments unrelated to the body of the problem.
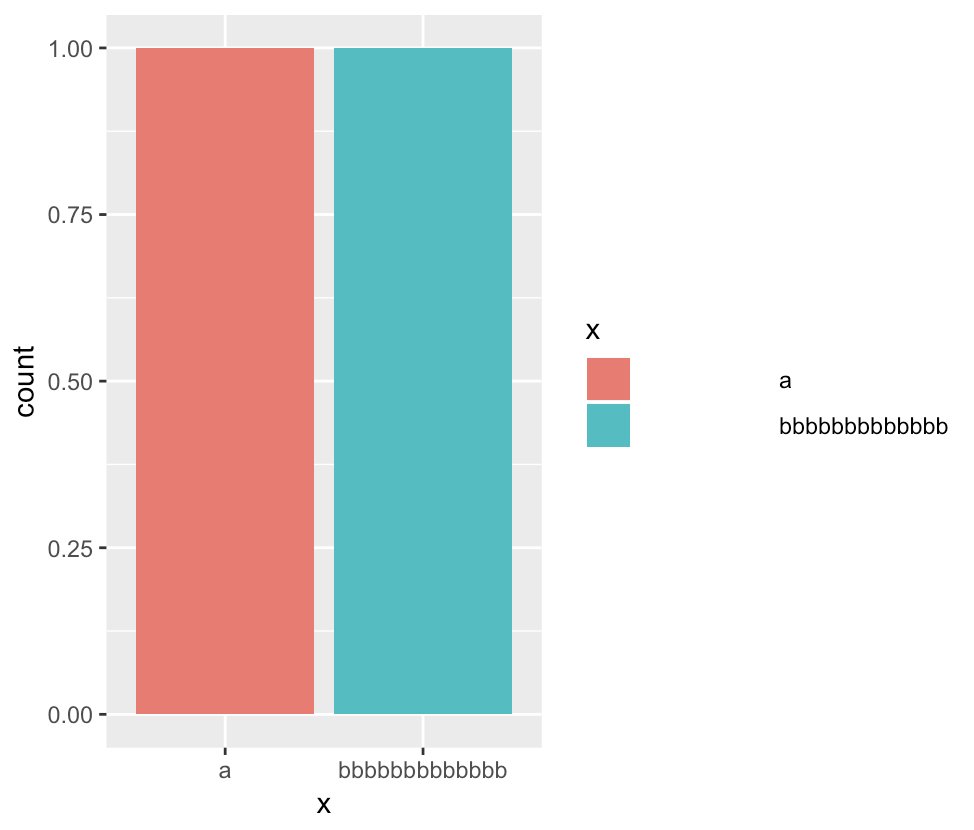
@tidyverse tidyverse deleted a comment from adefazio Oct 30, 2017
@tidyverse tidyverse deleted a comment from Huimincheng2015 Oct 30, 2017
@tidyverse tidyverse deleted a comment from R-Joe Oct 30, 2017
@tidyverse tidyverse deleted a comment Oct 30, 2017
@tidyverse tidyverse deleted a comment from ptoche Oct 30, 2017
@hadley hadley removed the ready label Oct 30, 2017
@hadley
Copy link
Member

hadley commented Nov 1, 2017

library(ggplot2)
df <- data.frame(x = c("a", "bbbbbbbbbbbbb"))

ggplot(df, aes(x = x, fill = x)) +
  geom_bar() +
  theme(legend.text = element_text(margin = margin(l = 50)))

@hadley
Copy link
Member

hadley commented Nov 1, 2017

The basic problem is that I have no idea how the legend code works any more, and it's extremely complex due to the many possible places that theme settings can come from.

@karawoo
Copy link
Member

karawoo commented Nov 1, 2017

I looked into this a bit at the end of the summer but never figured out the legend code enough to tackle it 😞 . I think the approach would need to be similar to what we did for strip labels, but I remember it being still more complicated for legends.

@clauswilke
Copy link
Member

I think I've got this working now (see: #2556), except for a minor problem with the default hjust setting.

library(ggplot2)
df <- data.frame(x = c("a", "bbbbbbbbbbbbb"))

ggplot(df, aes(x = x, fill = x)) +
  geom_bar() +
  theme(legend.text = element_text(margin = margin(l = 50), hjust = 0))

screen shot 2018-05-07 at 12 32 17 am

@hadley hadley closed this as completed in 6b09d17 May 8, 2018
@lock
Copy link

lock bot commented Nov 4, 2018

This old issue has been automatically locked. If you believe you have found a related problem, please file a new issue (with reprex) and link to this issue. https://reprex.tidyverse.org/

@lock lock bot locked and limited conversation to collaborators Nov 4, 2018
Sign up for free to subscribe to this conversation on GitHub. Already have an account? Sign in.
Labels
bug an unexpected problem or unintended behavior
Projects
None yet
Development

No branches or pull requests

4 participants