New issue
Have a question about this project? Sign up for a free GitHub account to open an issue and contact its maintainers and the community.
By clicking “Sign up for GitHub”, you agree to our terms of service and privacy statement. We’ll occasionally send you account related emails.
Already on GitHub? Sign in to your account
Secondary axis doesn't show axis ticks or labels with coord_trans #2990
Comments
|
Reprex: library(ggplot2)
ggplot(mtcars, aes(cyl, mpg)) + geom_point()  +
scale_y_continuous(sec.axis = sec_axis(~.+10, name='MPG + 10'))ggplot(mtcars, aes(cyl, mpg)) + geom_point() +
scale_y_continuous(sec.axis = sec_axis(~.+10, name='MPG + 10')) +
coord_trans()Created on 2018-11-09 by the reprex package (v0.2.1) |
|
It seems so. At least it predates my changes from #2796 and is present with version 3.0.0. I'll need to look into this further to be certain. Will do when I'm back at my desktop. |
|
This problem comes from here in Lines 192 to 195 in 868fdb7
If I replace the code with below, at least the labels are shown (the locations are wrong, though). out$major <- out$major_source
out$minor <- out$minor_source
out$arrange <- scale$axis_order() |
|
If |
|
I played around with this a little on my branch containing my most recent sec.axis patch (#3040) and can confirm the misalignment is still an issue. Interestingly, it's unique to all the other misalignment issues. It seems that when # loading local dpseidel/revert2796 + suggested coord_trans patch
library(ggplot2)
c <- ggplot(mtcars, aes(cyl, mpg)) +
geom_point() +
scale_y_continuous(sec.axis = sec_axis(~ . + 10, name = "MPG + 10")) +
coord_trans()
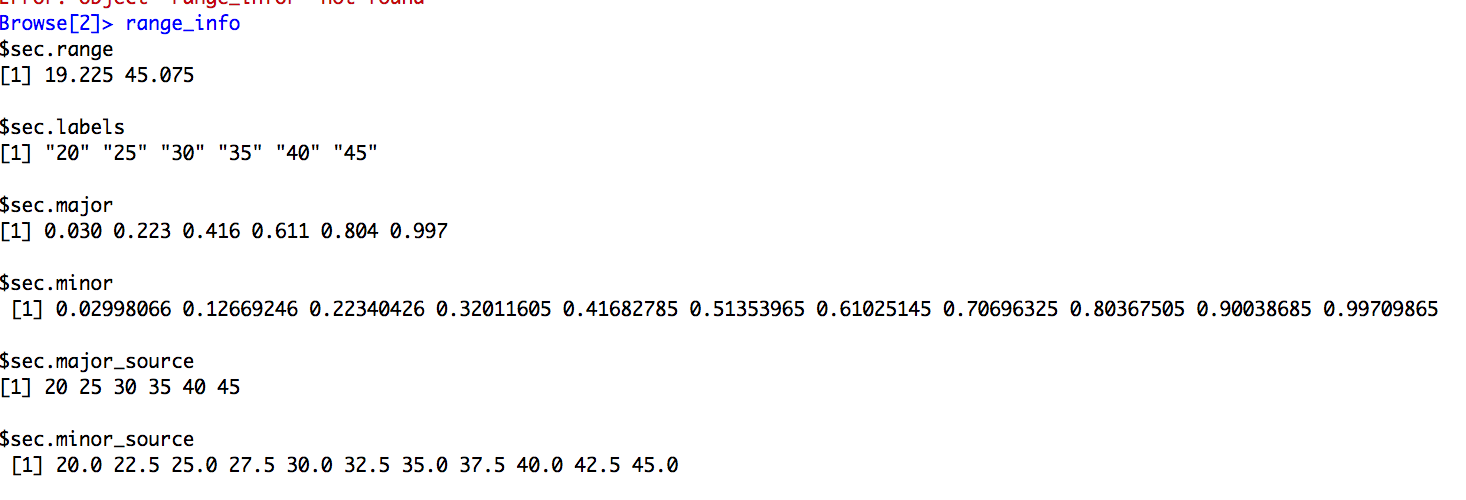
A screenshot of output from within Notably, and likely a separate bug worth flagging in its own issue, the layer_scales(c)$y$break_info()
#> $range
#> [1] 10.4 33.9
#>
#> $labels
#> [1] "15" "20" "25" "30"
#>
#> $major
#> [1] 0.1957447 0.4085106 0.6212766 0.8340426
#>
#> $minor
#> [1] 0.0893617 0.1957447 0.3021277 0.4085106 0.5148936 0.6212766 0.7276596
#> [8] 0.8340426 0.9404255
#>
#> $major_source
#> [1] 15 20 25 30
#>
#> $minor_source
#> [1] 12.5 15.0 17.5 20.0 22.5 25.0 27.5 30.0 32.5
#>
#> $sec.range
#> [1] 20.4 43.9
#>
#> $sec.labels
#> [1] "25" "30" "35" "40"
#>
#> $sec.major
#> [1] 0.1957447 0.4085106 0.6212766 0.8340426
#>
#> $sec.minor
#> [1] 0.0893617 0.1957447 0.3021277 0.4085106 0.5148936 0.6212766 0.7276596
#> [8] 0.8340426 0.9404255
#>
#> $sec.major_source
#> [1] 25 30 35 40
#>
#> $sec.minor_source
#> [1] 22.5 25.0 27.5 30.0 32.5 35.0 37.5 40.0 42.5Created on 2018-12-16 by the reprex package (v0.2.1) Since this is a scale expansion issue, misalignment is fixed if one specifies |
|
@dpseidel do you have any idea how to handle this most gracefully? |
|
I'll need to look back into it. I'll plan my own private dev day this weekend to dig into this and other open axis/scale issues 👍 |
|
This seems related to #3338 in that |
|
This old issue has been automatically locked. If you believe you have found a related problem, please file a new issue (with reprex) and link to this issue. https://reprex.tidyverse.org/ |


Exactly the same issue as #2072, which I take it was fixed since it is closed.
The secondary axis ticks and labels do not show up when coord_trans is present, even if using the identity transformation. The axis label ("name" parameter) does still appear.
For example, roughly taking from the examples in sec_axis:
works as expected, but
loses the axis ticks and labels (but keeps the title "MPG + 10").
The text was updated successfully, but these errors were encountered: