-
Notifications
You must be signed in to change notification settings - Fork 1
Home
sensitivity v.s. specificity in medical test
- “The problem with the accuracy statistic is that it’s meaningless"
- Generally speaking, “a test with a sensitivity and specificity of around 90% would be considered to have good diagnostic performance"
- “The initial tests are selected because they have high sensitivity (>99% in the case of HIV tests),” he said. “The expectation is that these tests do not miss patients with disease–and that all of those with positive tests (which could be a large proportion) will then undergo the highly-specific diagnostic gold standard test to confirm the diagnosis.” The second step is meant to rule out the many false-positives resulting from the first test.
screening – which is finding early, non-symptomatic cases of disease in the general population. That’s different from diagnosis – which is when doctors try to find out exactly what’s wrong in people who are already complaining of symptoms.
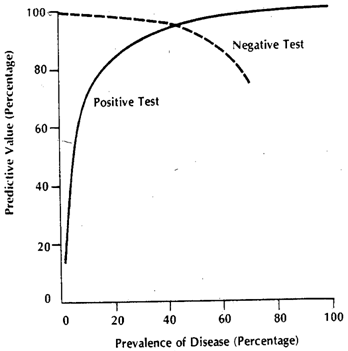
Positive predictive value (PPV) – a statistic that encompasses sensitivity, specificity, as well as how common the condition is in the population being tested. positive predictive value, which reflects the likelihood that a positive test result correctly indicates the presence of the disease (for screening in public heath)
One should always ask questions about the population that was studied, and whether those people are comparable to the people who would be tested in the real world. (the prevalence of the disease in general public for screening v.s. the prevalence in population w/ certain symptoms)
Positive and negative predictive values are influenced by the prevalence of disease in the population that is being tested. If we test in a high prevalence setting, it is more likely that persons who test positive truly have disease than if the test is performed in a population with low prevalence.
Sensitivity and specificity are characteristics of the test. The population prevalence does not affect the results.
A diagnosis is an identification of a disease via examination. What follows is a prognosis, which is a prediction of the course of the disease as well as the treatment and results. A helpful trick is that a diagnosis comes before a prognosis, and diagnosis is before prognosis alphabetically. more details
Proper interpretation of ultrasonography images depends on a basic understanding of how ultrasonography images are generated. For diagnostic ultrasonography, high-frequency sound waves are generated and received by the ultrasonography transducer, which is placed on the skin. Returning sound waves (echoes) are processed by a computer and displayed on a computer screen. A gray-scale image is produced when the ultrasonography machine operates in B-mode, or brightness mode, in which returning echoes are represented as bright dots; the brightness of the dots represents the strength of the reflected echoes. Echogenicity, therefore, refers to how bright or dark something appears in the gray-scale image; the brighter something appears, the more echogenic it is. With regard to the kidney, echogenicity generally refers to how bright or dark the kidney parenchyma appears in comparison to the liver.
Observer variation: Failure by the observer in a study or test to measure accurately, resulting in error. Inter-observer variation is the amount of variation between the results obtained by two or more observers examining the same material. Intra-observer variation is the amount of variation one observer experiences when observing the same material more than once.
A paired t-test is used when we are interested in the difference between two variables for the same subject. Often the two variables are separated by time. For example, in the Dixon and Massey data set we have cholesterol levels in 1952 and cholesterol levels in 1962 for each subject. We may be interested in the difference in cholesterol levels between these two time points.
A one way ANOVA is used to compare two means from two independent (unrelated) groups using the F-distribution. The null hypothesis for the test is that the two means are equal. Therefore, a significant result means that the two means are unequal. More details
Correlation is a technique for investigating the relationship between two quantitative, continuous variables, for example, age and blood pressure. Pearson's correlation coefficient (r) is a measure of the strength of the association between the two variables. More details
Standard deviation quantifies the variation within a set of measurement. Standard error quantifies the variation in the means from multiple sets of measurement. The confusing thing is that SE can be estimated from a single set of measurements, even though it describes the means of multiple sets of measurements. Thus, even if you only have a single set of measurements, you are often given the option to plot SE. In almost all cases you should plot the standard deviation, since graphs are usually intended to describe the data that you measured. More details
The standard deviation of the sample data is a description of the variation in measurements, while the standard error of the mean is a probabilistic statement about how the sample size will provide a better bound on estimates of the population mean, in light of the central limit theorem.[6]
Put simply, the standard error of the sample mean is an estimate of how far the sample mean is likely to be from the population mean, whereas the standard deviation of the sample is the degree to which individuals within the sample differ from the sample mean.[7] If the population standard deviation is finite, the standard error of the mean of the sample will tend to zero with increasing sample size, because the estimate of the population mean will improve, while the standard deviation of the sample will tend to approximate the population standard deviation as the sample size increases. More details
- Home
- Statistics
- Bioinformatics
- Machine Learning
- Deep Learning
