DebuggingProcess
#This page describes step-by-step process of debugging the business process created in process designer.
The inspector in the Lombardi environment includes several tools that allows us to complete tasks.
A process instance is a run-time execution of process model. The inspector allows the user to view and manage instances.
For a selected instance of a process, the user can wish to execute the model step-by-step. The user would wish to step through and debug the process in order to validate data flow implementations. This provides users an advantage of seeing the variables used in each step and the value that they currently hold.
Debug mode in Process Designer ensures an iterative approach to process development such that your process applications meet the goals and needs of everyone involved.
Here is an example of how debug mode can be used in process designer.
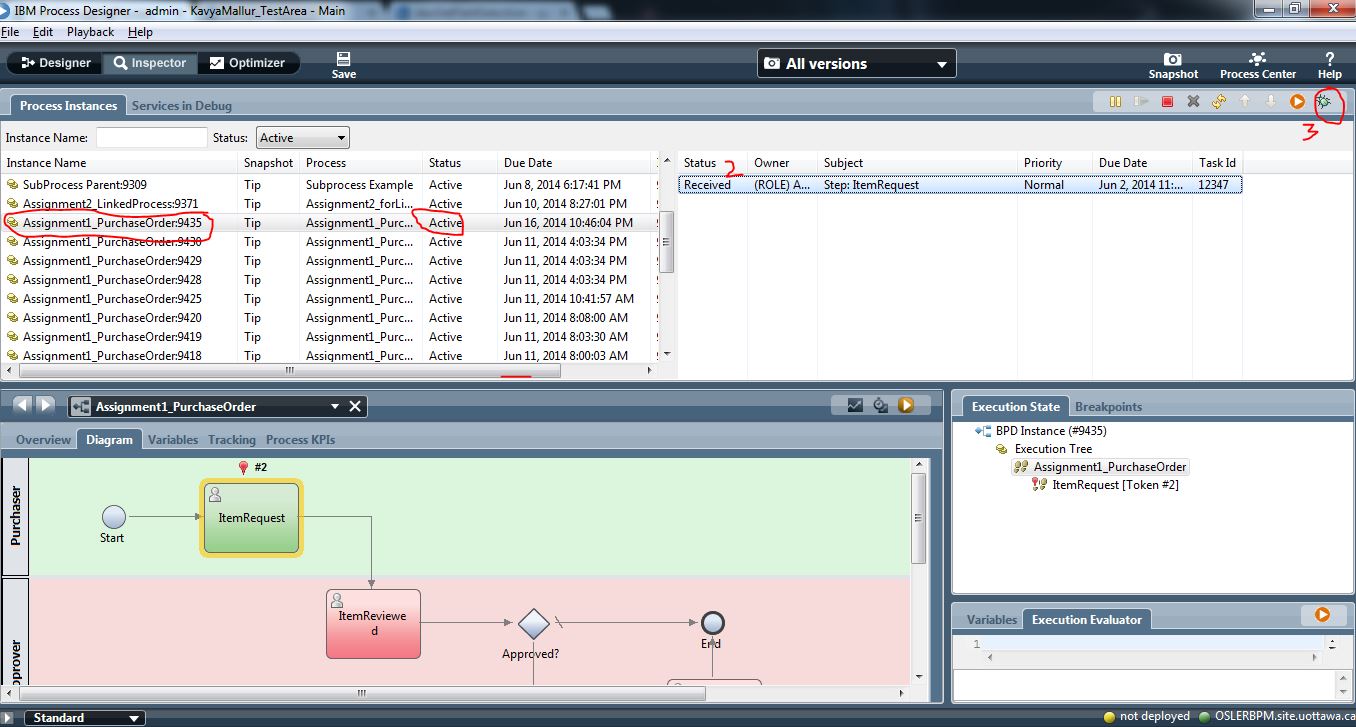
- Step1: Open the process that you want to debug. Click on the 'run' button(seen on the right end of the designer window).
-
Step2: A process instance is created on running a process. And tasks relevant to that instance are seen on the right side of the window as shown in the screenshot
-
Step3: Select the first displayed task and click on 'Debug' task icon. This action should open a debugging session in a browser window as shown below, after selecting a valid username to run the task

-
Step4: "Step" button in the debugger session in your browser can be clicked to proceed. Filling in the fields and clicking the Next button causes the debugger to move to the next step.


As seen in the above example, the debugger session in the browser allows the user to view data that one enters into any displayed coaches as well as the values that cause the underlying logic in the services and BPD to proceed along the available paths.
They can be used to see what value is stored in that variable at any given point.

The Execution Evaluator enables you to inspect the variable values as they change through the flow of the BPD. You can also manipulate variables in the Execution Evaluator using JavaScript expressions to validate your process implementation.

Thus, this insight can be extremely helpful when issues are identified.