

JLagmarker automatically detects user interactions and corresponding system responses (interaction lag) in screen recordings of interactive workloads.
It produces a profile of user interaction lag for a given workload and system configuration. Different interaction lag profiles of the same workload can be compared to analyse how different system configurations affect user perceived system response times.
Read the following section for a brief description of interaction lag profiling and the corresponding paper for more details and a case study. It was published at IISWC'14 and awarded the conference's Best Paper Award.
Clone and build according to the build instructions, have a look at the sample workload or read the detailed description on how to use the program.
Jlagmarker measures the system response time following a user interaction for interactive Android workloads. This response time will be referred to as interaction lag.
Interaction lags are not measured by observing system statistics but rather by analysing video output of the executed workload. Thereby Jlagmarker allows to capture response times as seen from the user's point of view. This perspective might differ from underlying system activity.
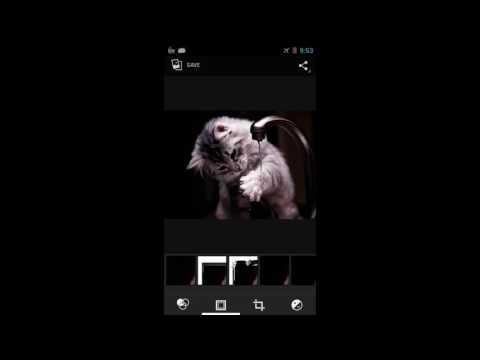
Here is an example video of an interactive workload (click to play):
The interaction lag profile generated by Jlagmarker reports the times between input (lag start) and earliest time a user could consider system response to be finished (lag end). It does that in two steps:
- Video Annotation: A workload video is stepped through interactively. For each input potential lag end frames are suggested and can be selected by a workload creator (see image below). This generates a detector configuration.

- Lag Detection: Using the detector configuration and annotated video data, lags in each video recorded of future executions of the same workload can be found automatically. This can be done for different system configurations and differences in response times can be compared.
- Java 8
Build project and jar files with:
$ ./gradlew build
Clean with:
$ ./gradlew clean
Build Eclipse project with:
$ ./gradlew eclipse
then import existing project into eclipse
This archive contains all the necessary data to execute jlagmarker for an example workload. The workload was recorded on a Qualcomm Dragonboard APQ8074 running Android Jelly Bean version 4.2.2 with Linux kernel 3.4.0.
NOTE: Further information on how to collect the provided workload data can be found in the publication mentioned above or my dissertation.
The data archive contains:
- a video of the screen output during workload execution (dataset01.ts)
- a description of touch screen input event timings (userinput_dataset01.csv)
- a sample configuration file for lag end suggestions (suggester_config_dataset01.csv)
- a file specifying the offset between initial input event and screen synchronisation flash in nano seconds (ifoffset_dataset01)
Let's assume it is extracted to WORKLOAD_HOME
To execute interaction lag annotation (i.e SUGGESTER mode), go to the project folder and execute:
$ java -jar ./build/libs/jlagmarker-x.x.x.jar -mode SUGGESTER -video $WORKLOAD_HOME/dataset01.ts -masks ./src/main/resources/masksspec.conf -input $WORKLOAD_HOME/userinput_dataset01.csv -ifoffset `cat $WORKLOAD_HOME/ifoffset_dataset01` -outPref sampleExec -outDir $WORKLOAD_HOME
This command starts the interactive workload annotation for dataset01. All execution results are written to $WORKLOAD_HOME/lmrun_SUGGESTER_sampleExec. During execution an html file is generated in the output folder ($WORKLOAD_HOME/lmrun_SUGGESTER_sampleExec/markup.html) displaying the current workload annotation progress. (I know, it is not a great GUI. A better one is currently being developed.)
java -jar ./build/libs/jlagmarker-x.x.x.jar -mode DETECTOR -dconf $WORKLOAD_HOME/lmrun_SUGGESTER_sampleExec/suggestions/detector_config.csv -suggImgs $WORKLOAD_HOME/lmrun_SUGGESTER_sampleExec/suggestions/ -video $WORKLOAD_HOME/dataset01.ts -masks ./src/main/resources/masksspec.conf -input $WORKLOAD_HOME/userinput_dataset01.csv -ifoffset `cat $WORKLOAD_HOME/ifoffset_dataset01` -outPref sampleExec -outDir $WORKLOAD_HOME
This command automatically analyses the given video using the image suggestions and detector configuration generated in the previous step to find interaction lags. All generated output is written to $WORKLOAD_HOME/lmrun_DETECTOR_sampleExec.
In this example the video being analysed automatically is the same as used for suggestion. However, the true potential of Jlagmarker lies in analysing a different video of the same workload execution. Once the suggestion data is generated it can be used an arbitrary number of times for automatic detection.
TBD
Copyright 2017 Volker Seeker volker@seekerscience.co.uk.
Released under the terms of the GPLv3 license. See LICENSE.txt for details.