Having many lazy chunks slows down rebuilds #9460
Comments
|
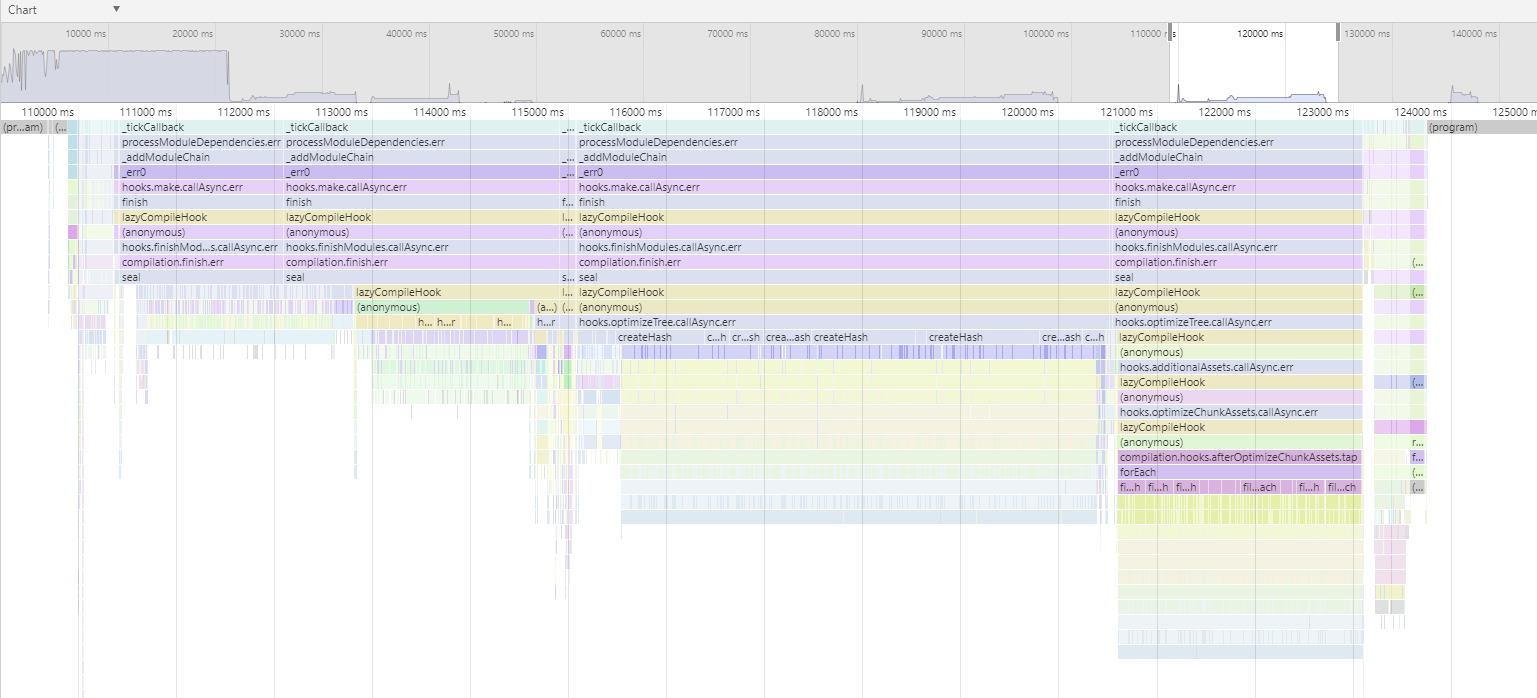
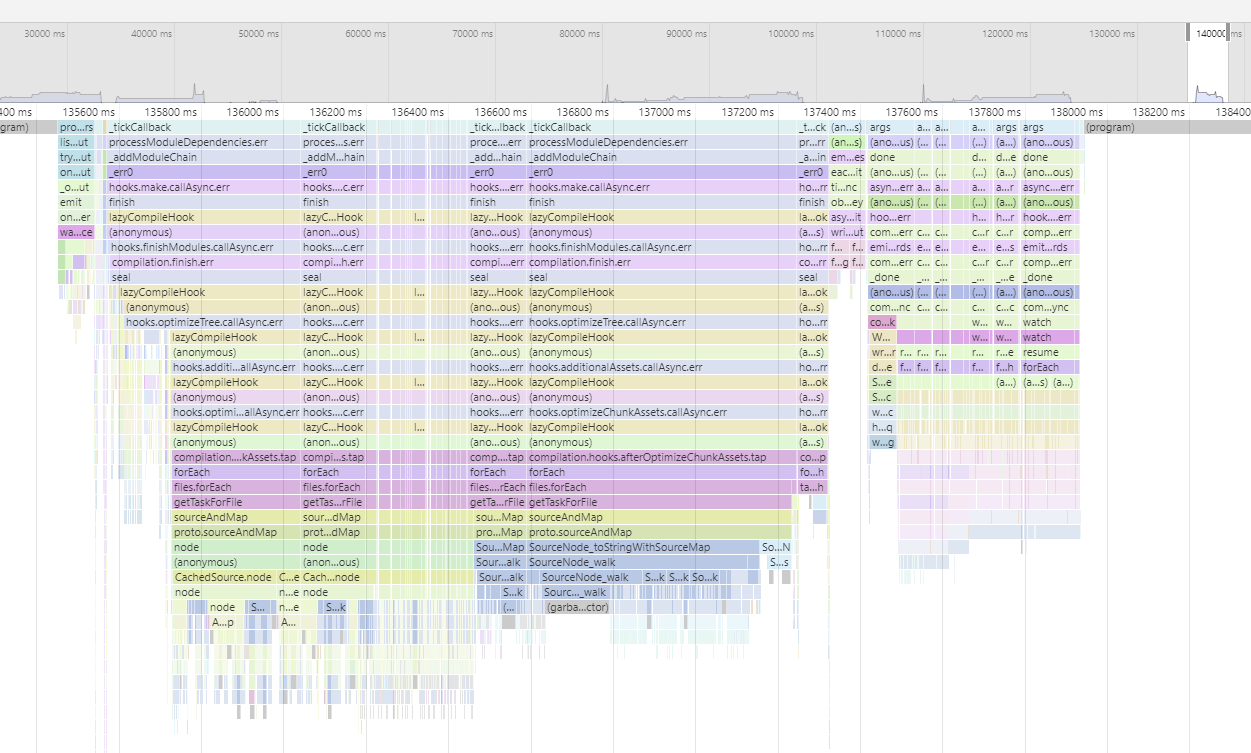
Also added a Chrome Devtools CPU profile to the repository now. This is what the first rebuild, with This is what the second rebuild, with just a save, looks like: This is what the third rebuild, removing the lazy modules, looks like: All three have a lot going on in |

|
Seem to be caused by the ProgressPlugin. As workaround disable progress reporting. |
|
I tried rebuilding by adding
It does seem like the progress reporting has an impact, but it's not obvious to me that it's the root cause. Taking progress reporting out seems to speed up things in general. With lazy chunks there is a lot more being written to the console so it would make sense that whatever extra computation is happening also causes more console writes, slowing it down further. |
|
I've also now added a variation of the repo where all the imports are ESM static imports instead of dynamic ones. You can switch between them by commenting out one of the lines below, where With this I tried rebuilding with and without both progress reporting (
I think turning off sourcemaps is an interesting comparison because I expected that changing a large chunk (because it imports all previously lazy chunks statically) with sourcemaps would be fairly expensive because the sourcemaps for the whole chunk would have to change. Indeed having the same large chunk but turning off sourcemaps resulted in 1/5 of the rebuild time. Even without sourcemaps I still expected a cost for rebuilding a new large string for that chunk though. I expected that this problem could be mitigated by having dynamic imports splitting out the large chunk into many smaller chunks. When any single chunk changes, the sourcemap computation would be much smaller. But this didn't really happen, turning sourcemaps off with dynamic imports resulted only in a 5/6 rebuild time. I also noticed that rebuilding it without sourcemaps but with progress reporting will still spend a lot of time in So given the same total compilation size and shape I expected that splitting one large chunk into many small chunks would always result in smaller rebuild times in development mode. There might be cases where this shouldn't happen, but I think it would mostly be when the compilation moves imports around chunks. |
|
Best use |
|
I fixed the ProgressPlugin performance in a PR, so progress should no longer make a bigger difference. I figured out that most time is spend in Chunk Graph building. A lot of modules are added to all Chunks which are later removed by optimization. I will look into refactoring this and merging this optimization into the Graph building to avoid adding this unnecessary modules in the first step. But after all this seem to be pretty fast. Your app has ~7,500 modules and 3,500 chunks and it rebuilds in 2.5s... Anyway the static imports case seem to suggest that <1s should be possible... |
|
I do agree that 2.5s for 3,500 chunks is pretty fast, no real question about that. I don't know of any real project that has that many. I also agree that eval sourcemap is much better for these cases. At the limit if someone really wants speed no sourcemaps is the fastest option. I got started looking at this because of angular/angular-cli#15086. I think what ends up happening in non-trivial setups and codebases is that there's a compounding effects. A webpack setup has more plugins that might be hooking into those phases that get triggered for lazy chunks. In the Angular CLI setup I saw that happening with https://github.com/aackerman/circular-dependency-plugin I think. Then even though no one has 3,500 lazy chunks, I have seen around ~120 chunk cases where some of those are much bigger, and some might be split chunks due to common modules. I didn't test those cases. But I expect that the lazy chunk computation that we see happening here is related to the number of modules in the lazy chunk, and maybe their relation to other chunks. So I think in a real project that has less but bigger chunks and more plugin, the effect is more dramatic. There's also an argument that those computations would similarly affect the static import case. But I think that when that happens, splitting code into more chunks should speed up the rebuild instead of slowing it down. Which is to say, I think that in real projects with a lot of code you will should faster rebuilds if you split into chunks using dynamic imports, instead of slower rebuilds. |
|
#9472 should give some improvements |
|
try 4.38.0 |
|
With 4.38.0 I see:
So as far as I can tell, ProgressPlugin now doesn't really make a difference, sourcemap perf is better with dynamic chunks, and there doesn't seem to be much of a difference between dynamic imports vs static imports. I think these results super impressive compared to the previous ones, between 2x and 5x faster rebuilds for the dynamic import scenario:
Awesome work @sokra! As far as I'm concerned this particular issue is fixed, but if you feel like there's something else you'd like to look at feel free to reopen. |
|
🎉 |
Bug report
What is the current behavior?
Having many lazy chunks slows down rebuilds even when they don't change.
If the current behavior is a bug, please provide the steps to reproduce.
To repro follow the steps below. No tools aside from webpack and webpack-cli are used.
git clone https://github.com/filipesilva/webpack-3500-lazy-chunks && cd webpack-3500-lazy-chunksnpm installnpm run watchand wait for the first build./out-tsc/app/app/app.module.tsconsole.log(1);to the end of the file and savemain.jsandmain.js.mapcontent hashing JavascriptModulesPluginandafter chunk asset optimization SourceMapDevtoolPluginimport { AppRoutingModule } from './app-routing.module';line (this file imports all the lazy modules) and saveWhat is the expected behavior?
I think this is a bug because rebuild time should be mostly dominated by the size of changes to the affected chunks, and only minimally affected by other unchanged chunks.
Other relevant information:
webpack version: webpack@4.36.1
Node.js version: v10.16.0
Operating System: Windows 10 1903
Additional tools: webpack-cli@3.3.6
The text was updated successfully, but these errors were encountered: