This project was bootstrapped with Create React App.
The master branch used the Hong Kong Schools location data
The branch 'province-layer-of-china' loads the map of China in the center with a layer of provinces.
https://hk-schools-map.millielin.com
This project follows the tutorial from Mapbox Doc to set up a Map in Mapbox GL JS. https://docs.mapbox.com/help/tutorials/use-mapbox-gl-js-with-react/#getting-started
http://www.convertcsv.com/csv-to-geojson.htm
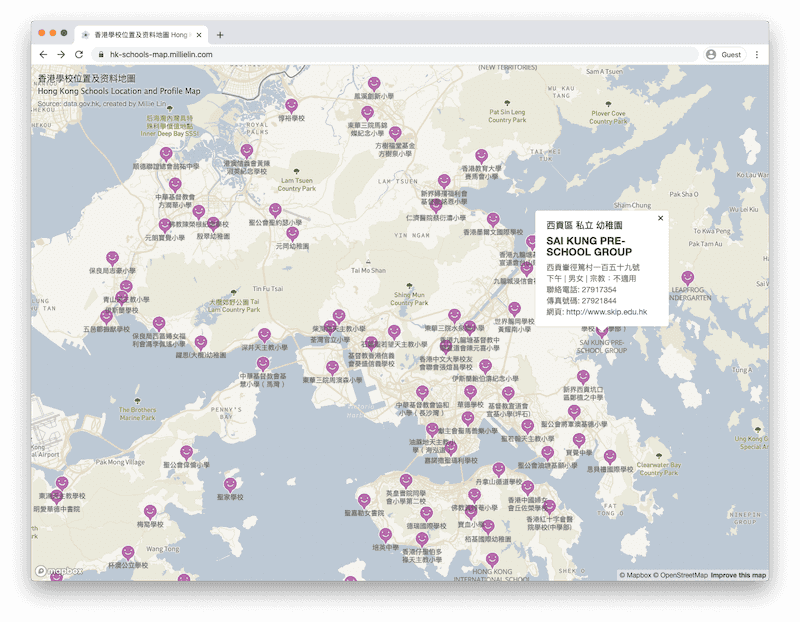
Here you go the screenshot:
After the beginners course of the react.js web framework, I want to practice it and create things on data visualisation. Get inspired by some other map based interactive project created in Mapbox, I'd like to find data to learn and practice how Mapbox and React.js can work together.
Thought of the Hong Kong Government has launched a site DATA.GOV.HK for the public to access the official data, I explored and found the dataset of Hong Kong School Location and Information there. The data is straight forward with coordinates per school as well as basic school properties such as school level, district, finance type, contact, etc.
- Get inspired. Explore open data sources and possible techniques to see the possibilities.
- Define purpose. Thought from business perspective, I'd like to design a Hong Kong Schools map for people to learn about Hong Kong school information by geolocation.
- Define feature scope. Though the dataset is possible to achieve advanced features such as filters or binding with some other databases, it would be easier to get started by minimizing the initial scope. The initial scope is to add school markers which allow popup to show detailed information on touch or click. The map should be responsive and able to use on both mobile and desktop modern browsers.
- Prepare the data. The schools location and information JSON on the Hong Kong GOV site is not well structured in geojson format. So that I finnaly downloaded the .csv file and used the online converting tool CSV to GeoJson and download the .geojson file in about 5MB. There are close to 2000 schools data in the single .geojson file which cause extra waiting time for the school markers to load on the live site.
- Development. For such data visualisation map, the development process is actually a way of design. As exploring the Mapbox examples and documentation, as a designer, I would be able to see the possible interactions and styles and adjust the styles and icons through the data source directly.
- Intended to practice the React.js that I just learned, I used the npm command
npx create-react-app [project-name]to initiate the react project. Instead of using pure javascript to load the map as Mapbox example, I have to follow the syntax of React to get the map on with Mapbox GL JS API. - There were some problems that I encountered during the development that different marker or symbol loading method with the Mapbox GL JS could lead to different marker presentation and web performance results. Both methods were on the Mapbox examples and I've tested and tried different method and finnaly figure out the performance issue by using the symbol layer method.
- Intended to practice the React.js that I just learned, I used the npm command
- Deployment. As the data is in '.geojson' format and there is no database used, the map is could be built as a static site through
react build. Finally, I deployed the site on Netlify through github.
It would be better if the map could get more advanced features such as filters or search feature for easier school exploration. It consumes time for me to learn more about the skills on coding.
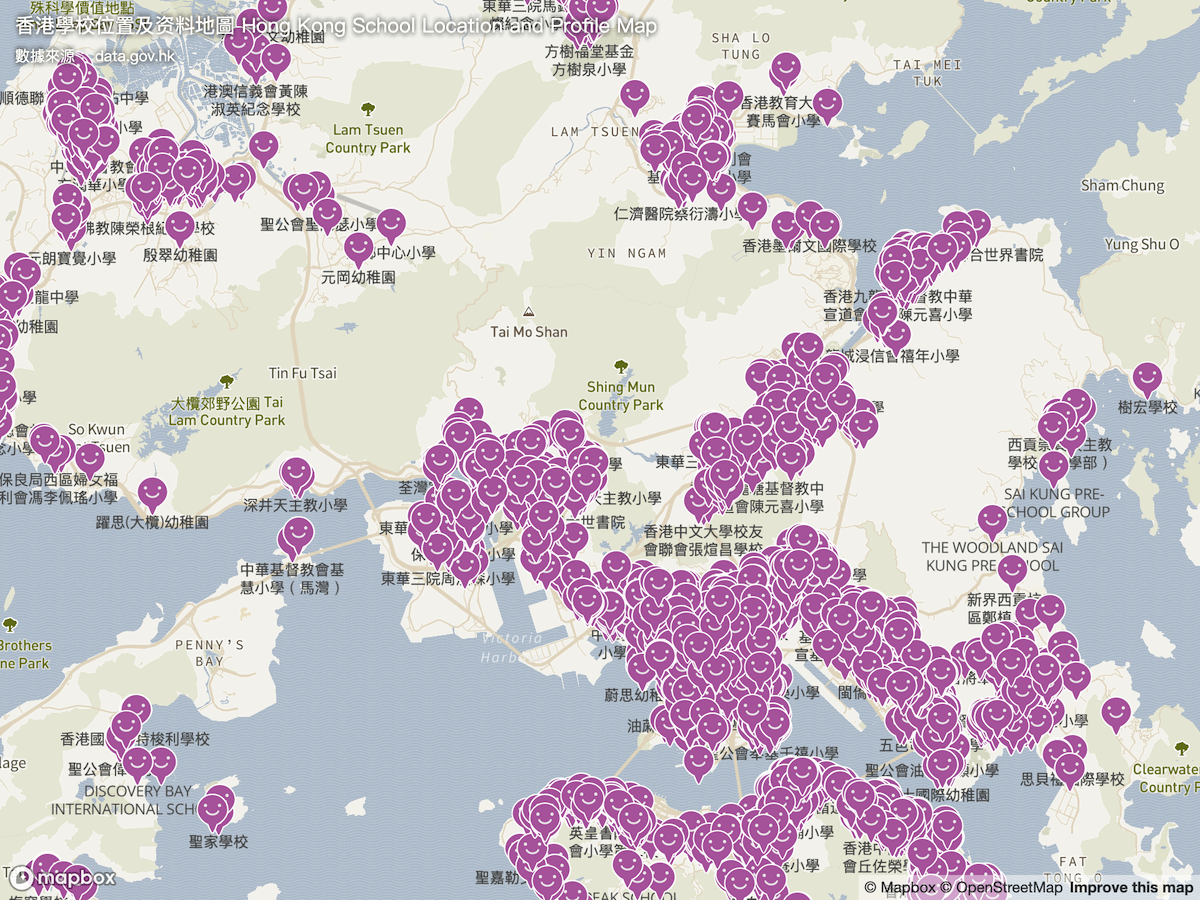
As this is an experimental data visualization project, I am happy that I have been able to visualize the data on a map. Schools location and density can actually reflects a district population, residential area, etc.
One of the rendered map with all schools location appears at the same time looks like the image below:
This mini-project has been open sourced. If you are interested to develop the map further, adding filters, binding other schools data, feel free to clone the repository on github and keep coding for a better education tool.
In the project directory, you can run:
Runs the app in the development mode.
Open http://localhost:3000 to view it in the browser.
The page will reload if you make edits.
You will also see any lint errors in the console.
Builds the app for production to the build folder.
It correctly bundles React in production mode and optimizes the build for the best performance.
The build is minified and the filenames include the hashes.
Your app is ready to be deployed!
See the section about deployment for more information.