Does x32dbg support source level debugging? #2264
Comments
|
You can use source level debugging, if you have the source code, compile your project to use the appropriate debug flags and options for assembler/compiler and for the linker to output a pdb file. |
|
@mrfearless |
|
The special build of exe - comes from your own compiled source, which uses the correct debug flags and options to create the debug build of your exe along with the full pdb file for your exe. For me to build a properly debug source exe requires that i include the following switches for assembler (ml.exe):
And for the linker i require the following:
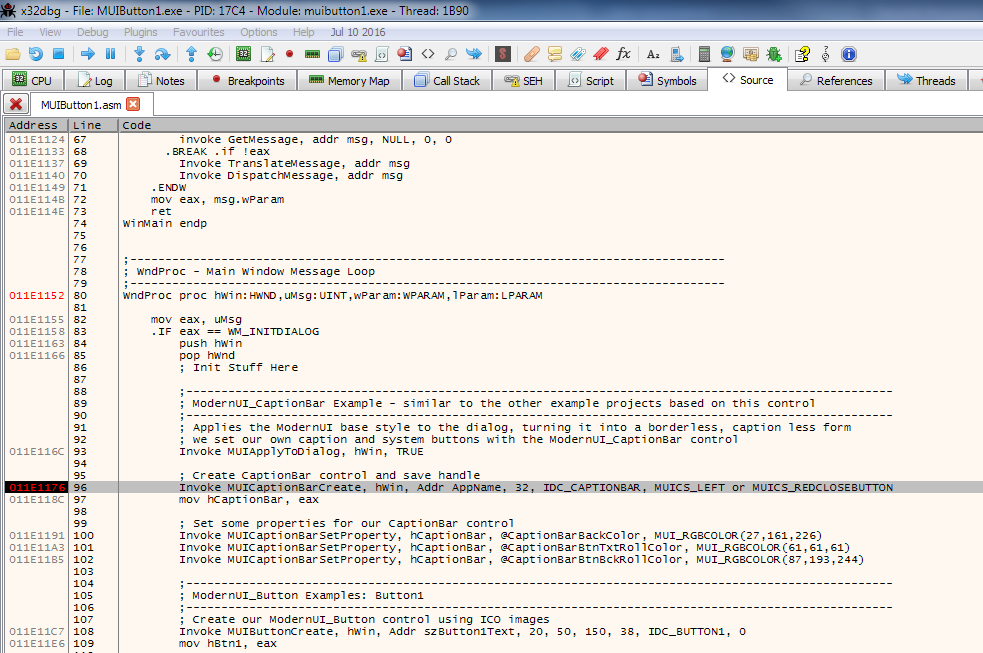
Once i debug MyApp.exe in x64dbg, i can view the source as the pdb and source are to be found alongside my special MyApp.exe debug build. For C/C++ source level debugging, it will require specific options set when compiling, may have to ask someone who knows C/C++ to indicate the proper flags and switches required. |
|
Generally any build with a pdb will have source lines. Debug builds have
better line-by-line stepping, but release builds work too.
The linker flag is generally /DEBUG(:FULL) (Linker -> Debug in VS)
…On Tue, 10 Dec 2019 at 14:47, fearless ***@***.***> wrote:
The special build of exe - comes from your own compiled source, which uses
the correct debug flags and options to create the debug build of your exe
along with the full pdb file for your exe. For me to build a properly debug
source exe requires that i include the following switches for assembler
(ml.exe):
ML.EXE /c /coff /Cp /Zi /Zd /nologo /I:"\Masm32\Include" MyApp.asm
And for the linker i require the following:
LINK.EXE /SUBSYSTEM:WINDOWS /DEBUG /DEBUGTYPE:CV /PDB:"MyApp.pdb"
/VERSION:4.0 /LIBPATH:"\Masm32\Lib" /OUT:"MyApp.exe" MyApp.obj, MyApp.res
Once i debug MyApp.exe in x64dbg, i can view the source as the pdb and
source are to be found alongside my special MyApp.exe debug build.
For C/C++ source level debugging, it will require specific options set
when compiling, may have to ask someone who knows C/C++ to indicate the
proper flags and switches required.
—
You are receiving this because you are subscribed to this thread.
Reply to this email directly, view it on GitHub
<#2264?email_source=notifications&email_token=AASYFGIUSI2VFCMPJ3XR4L3QX6MWBA5CNFSM4JYZRZ62YY3PNVWWK3TUL52HS4DFVREXG43VMVBW63LNMVXHJKTDN5WW2ZLOORPWSZGOEGPI3TA#issuecomment-564039116>,
or unsubscribe
<https://github.com/notifications/unsubscribe-auth/AASYFGIZSPJGO7DCHEDVULTQX6MWBANCNFSM4JYZRZ6Q>
.
|
|
Thanks for your reply. I will try it now |
|
Closing this for now. Let me know if you have further questions. |
I want to view the source code of the program in x32, and the page is blank after clicking the source code bar. Is it because x32 does not support source code viewing, or does it need another way to display source code?
The text was updated successfully, but these errors were encountered: