Skip to content

[Example] Display a chart based on counted value in a group

License

Notifications You must be signed in to change notification settings

xavdid/airtable-grouped-chart

Folders and files

NameName
Last commit message
Last commit date

Latest commit


History

5 Commits


Repository files navigation

📊 Grouped Chart Custom Block for Airtable

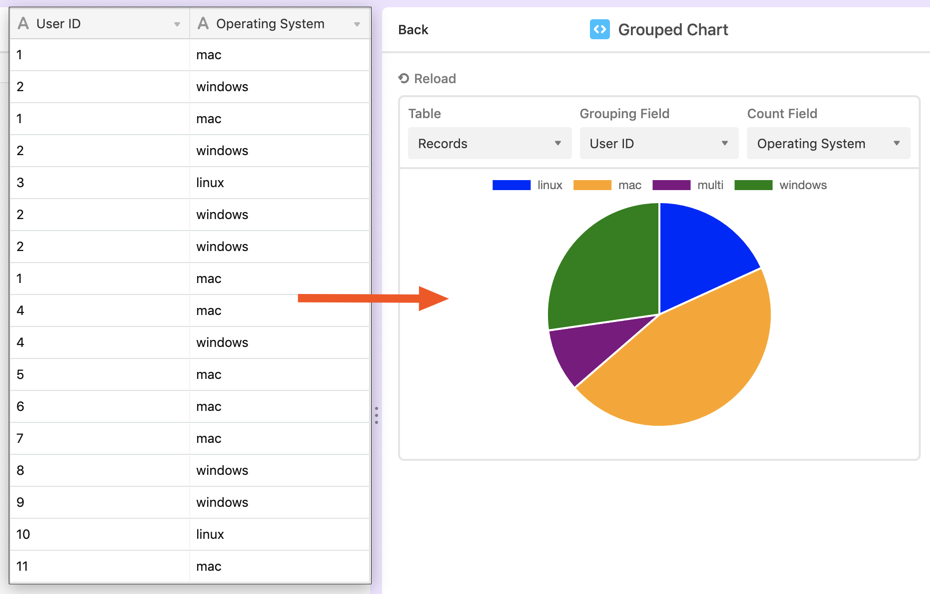
This block allows you to make a pie chart, counting each group at most once.

Adding this to your Airtable

  1. Create a custom block
  2. Select "Remix from Github"
  3. Paste this repo url: https://github.com/xavdid/airtable-grouped-chart

Modifying This Block to Fit Your Use Case

Follow the steps in the Getting Started Guide to run this code locally. You can then deploy it to your base.

About

[Example] Display a chart based on counted value in a group

Topics

Resources

License

Stars

Watchers

Forks