Showing the percentage in confusion matrix is a good way to visualize the classification performance. It can give you a straightforward understanding of the evaluation results and guidance on how to improve your model. This is a small script to visualize percentaged confusion matrix using bootstrap template.
Follow app.py to generate your confusion matrix object using sklearn, and use cm.py module to generate the html confusion matrix report.
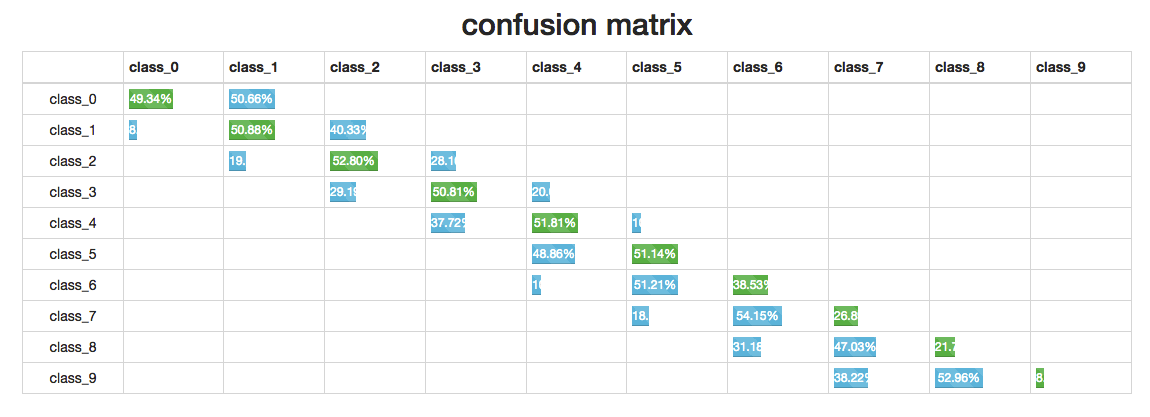
A sample html report is provided in the repo, as shown in the figure below: