SIDAM is written in Igor Pro and developed for analyzing 3D data (x, y, and energy) of spectroscopic-imaging scanning tunneling microscopy. SIDAM provides both a graphical user interface and a command line interface, offering users flexibility and convenience to unlock insights from data while maintaining reproducible analyses.
Frequently used features (gif movies):
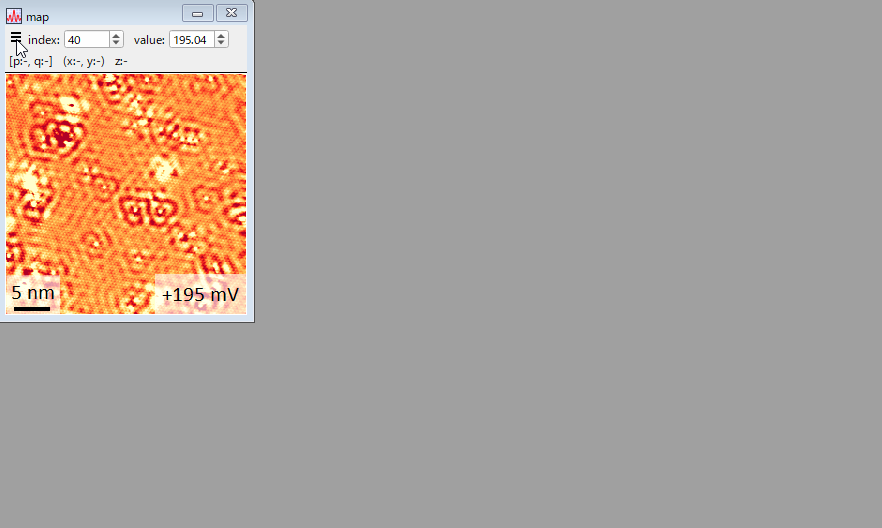
- Interactive viewers
- Background subtraction
- Fourier analysis
- Fourier transform
- Fourier filter
- Symmetrize Fourier transform
- Correlation
- Histogram
- Work function
Igor Pro 8 or later is required. Igor Pro 9 is recommended to use full features.
After cloning or downloading the macro files, copy them to the designated folders.
SIDAM/
├ LICENSE
├ readme.md
├ docs/
├ script/
└ src/
    ├ SIDAM.ipf -> Copy to Igor Procedures
    └ SIDAM/    -> Copy to User Procedures
Copy src/SIDAM.ipf and src/SIDAM to the Igor Procedures folder and the
User Procedures folder, respectively. If you don't know where the folders are,
choose Menubar > Help > Show Igor Pro User Files in Igor Pro.
Instead of copying the file and folder, you can also make shortcuts or symbolic links to them in the designated folders. This would be useful for updating SIDAM in the future if you clone the files.
If you use Igor Pro 8, you need an extension file. See issue #37.
Launch Igor Pro, choose Menubar > Macros > SIDAM in Igor Pro, and you will find a new menu item SIDAM in the menu bar. If Igor Pro is already running, you need to restart it after installing SIDAM.
Choose Menubar > SIDAM > Load Data... > from a File.... Alternatively, you can drag and drop data files into the window of Igor Pro. Supported files are Nanonis files (.dat, .sxm, .3ds, .nsp).
Choose a wave(s) you want to show in the Data Browser and choose Menubar > SIDAM > Display... > Display Selected Waves. Alternatively, you can press F3 after choosing a wave(s) you want to show in the Data Browser.
Click ☰ in the control bar of a window and you will find menu items of analysis available for the data shown in the window.
https://yuksk.github.io/SIDAM/
Expand to see a list of papers in which figures were made using SIDAM.
- Phys. Rev. B 105, 064507 (2022)
- Rev. Sci. Instrum. 92, 033702 (2021)
- Nat. Commun. 11, 5925 (2020)
- Nat. Mater. 18, 811 (2019)
- Phys. Rev. Lett. 122, 077001 (2019)
- Rev. Sci. Instrum. 89, 093707 (2018)
- Sci. Adv. 4, eaar6419 (2018)
- Nat. Commun. 8, 976 (2017)
- Phys. Rev. B 96, 075206 (2017)
- Phys. Rev. B 95, 115307 (2017)
- Nat. Commum. 7, 11747 (2016)
- Phys. Rev. X 5, 031022 (2015)
- Phys. Rev. B 91, 245312 (2015)
- Proc. Natl. Acad. Sci. 111, 16309 (2014)
- Phys. Rev. B 85, 214505 (2012)
- Nat. Phys. 8, 534 (2012)
- Phys. Rev. B 82, 081305(R) (2010)
- Science 328, 474 (2010)
- Science 323, 923 (2009)
- Nature 454, 1072 (2008)
- Nat. Phys. 3, 865 (2007)
- Phys. Rev. Lett. 99, 057208 (2007)
- Science 315, 1380 (2007)
- Phys. Rev. B 70, 161103 (2004)
- Phys. Rev. Lett. 93, 097004 (2004)
More than 200 color tables, which are scientifically derived, are imported.
The color range is adjusted to statistical values such as 3σ below and above the average of the shown image.
The interactive viewer of a spectrum or spectra. Positions of spectra can be acquired from any image, e.g., a simultaneous topograph.
Line profiles for 2D and 3D waves. Both waterfall and intensity plots are available for 3D waves.
Synchronize the layer index, ranges of axes, and cursor positions of multiple images.
Record positions you click in a wave. For example, if you click on impurities, the dimension of the resultant wave gives the number of impurities.
Data: BiTeI, https://doi.org/10.1103/PhysRevB.91.245312