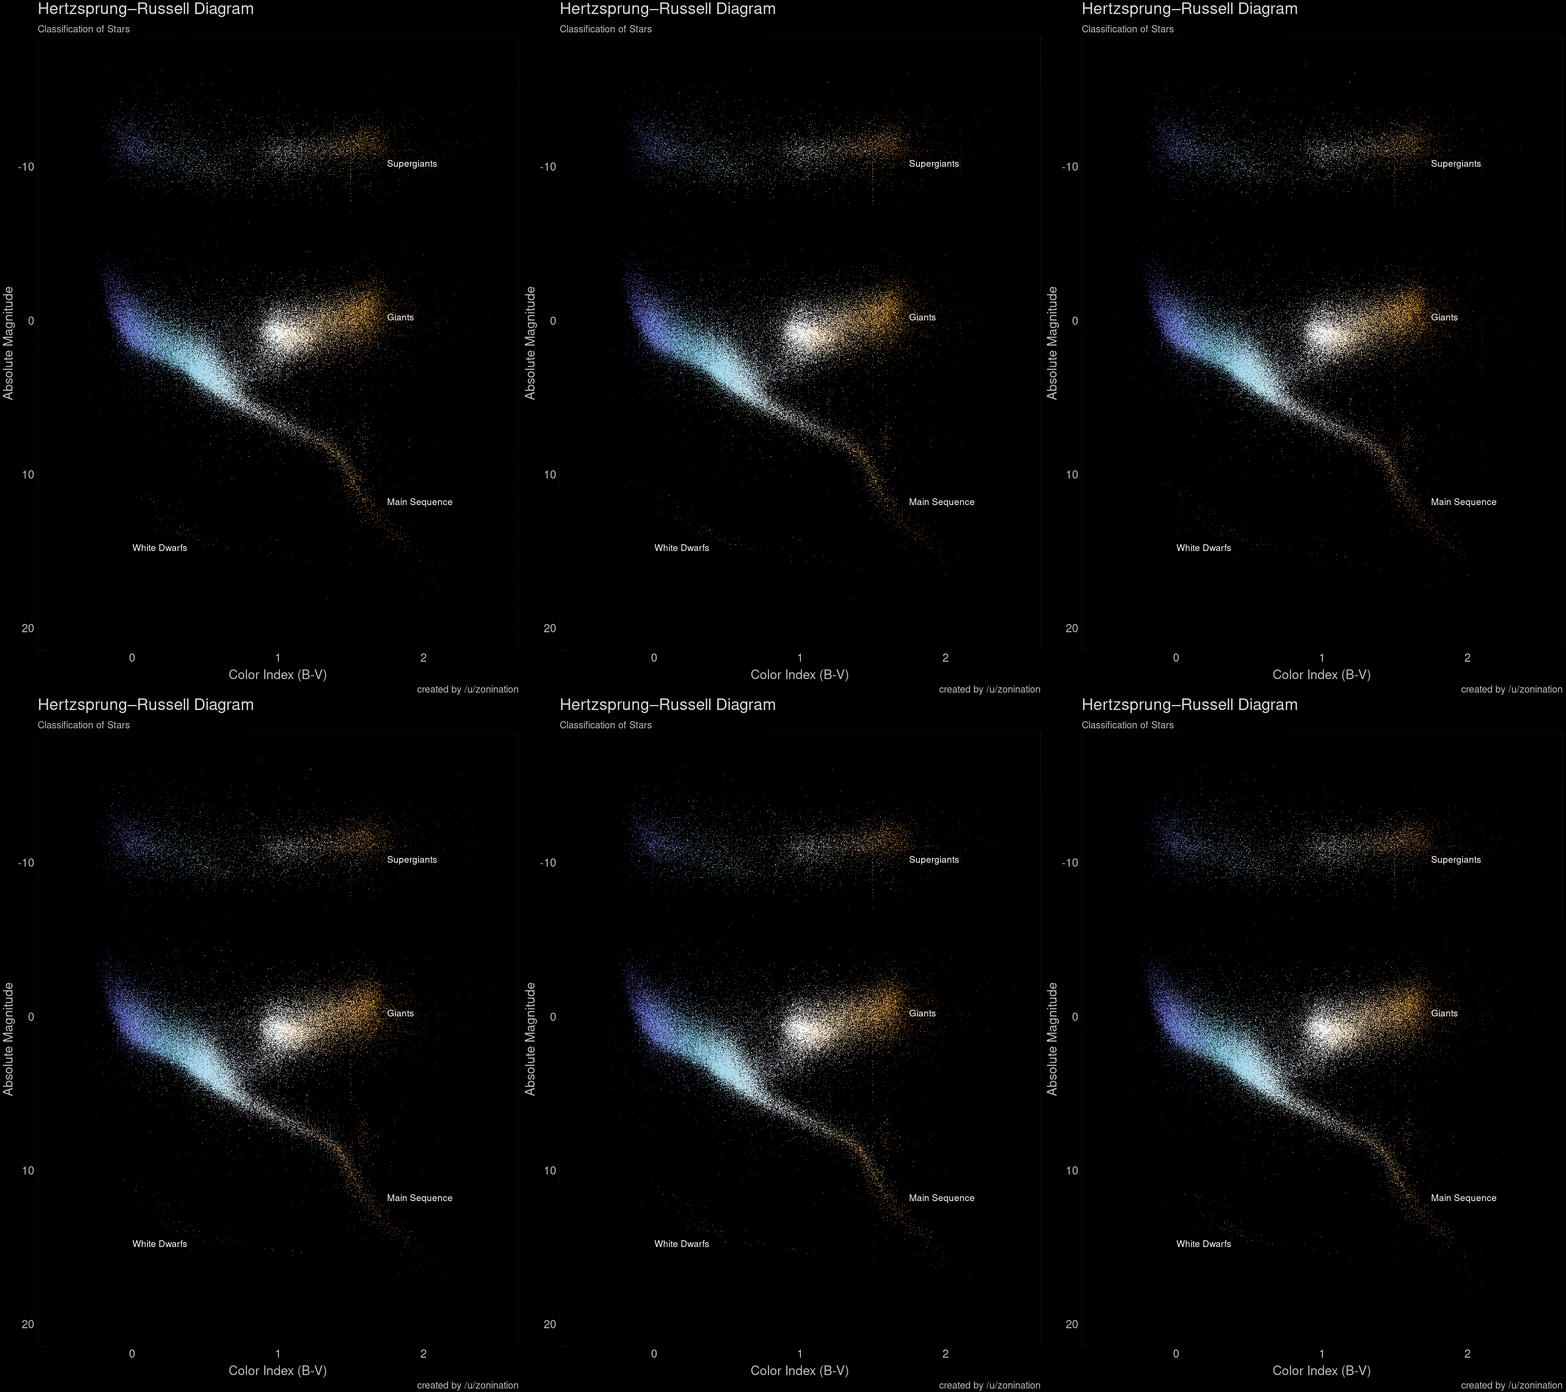
Got bored with a lot of the Hertzsprung–Russell diagrams out there, so I made and animated my own using 119,614 data points in a star catalog.
Stars twinkle for two reasons:
- Aesthetics
- Reduces overploting
If you're going to play with this:
- Make sure you have FFMPEG installed
- the last line is optimized to work with unix-like systems (Linux/Mac, basically). If you have Windows, replace it with
DEL star_anim*.png - make sure the second line has the correct working directory under
setwd().
- The HYG database
More info on H-R Diagrams from Wikipedia
- ggplot2
- Rstudio
I'm told that this star catalog may potentially contain inaccurate information. See comments here.
