First, you need to install cdiversity, or alternatively you can use the cdiversity.py file provided in the repository:
- pip install cdiversity
Then, you can run a repertoire analysis simulation with the toy example below. For a more complete overview, you can check out Examples/Analyze_sample.py.
Briefly, the analysis start by grouping Bcell into clones, and then use the obtained groups to compute various diversity metrics.
Available methods for clonal identification are junction, which simply group clones together only if they have the same junction. Then, there is the commonly used VJ-junction methods, which group together BCR with the same V and J genes, as well as some user-specificed junction similarity (clone_threshold). Finally, the last method is alignfree, which compute tf-idf embedings of the BCRs to perform a fast clustering without relying on the V and J germline genes alignements.
import pandas as pd
import cdiversity

df = pd.read_csv('Data/sample.csv', sep='\t')
clones_baseline, _ = cdiversity.identify_clonal_group(df, method='junction')
clone_VJJ, _ = cdiversity.identify_clonal_group(df, method='VJJ', clone_threshold = 0.1)
For the alignement free method [2], you need to compute the optimal threshold first using the negation sequence. Something important to keep in mind is that the optimal threshold will be different for each repertoire as it depends on the learned tf-idf embeddings. Please refer to Examples/Analyze_sample.py to see how to proceed. Note that, as the AF method needs to compute a distance matrix for all pairwise sequences, it scales as O(N^2) and becomes slow for repertoires with more than 10k sequences.
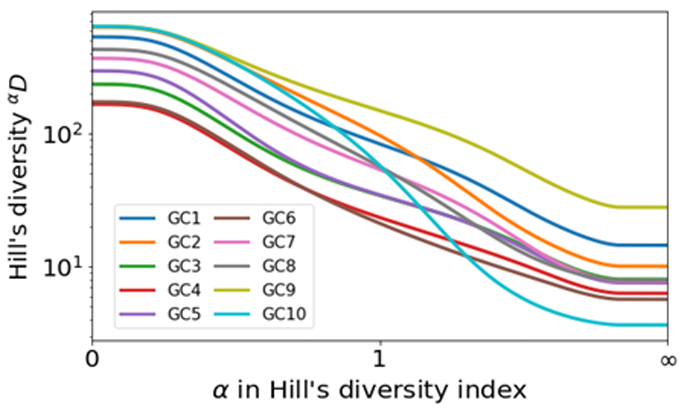
Once the clonal groups are obtained, you can compute any diversity indices or the Hill's diversity profile with a single command. Implemented indices are richness, richness_chao, Shannon_entropy, Shannon_entropy_chao, Simpson_index, dominance, eveness.
from collections import Counter

	clone_dict = Counter(clone_VJJ)
	diversity = cdiversity.Shannon_entropy_Chao(clone_dict)
	div_profile, alpha_axis = cdiversity.diversity_profile(clone_dict)
[1] Pelissier, A, Luo, S & al. "Exploring the impact of clonal definition on B-cell diversity: implications for the analysis of immune repertoires." Frontiers in Immunology 14 (2023).
[2] Lindenbaum, Ofir, et al. "Alignment free identification of clones in B cell receptor repertoires." Nucleic acids research 49.4 (2021): e21-e21.
[3] Nouri, Nima, and Steven H. Kleinstein. "Optimized threshold inference for partitioning of clones from high-throughput B cell repertoire sequencing data." Frontiers in immunology 9 (2018).
