Tutorial 4 Post processing of Automatically Generated Segmentations
This page provides instructions on how to create and quantify 3D models from CDeep3M results created in:
- Convert output of CDeep3M results to 3D models
- Apply filters to the automatic output to improve accuracy
- Obtain quantitative metrics (volume, surface area, centroid) of segmented objects
- Required tool installation instructions
- Running CDeep3M instance from Tutorial 2: Launch and train CDeep3M
A. Download the ZIP file entitled datasetfour.zip from:
https://github.com/CRBS/cdeep3m/wiki/data/datasetfour.zip
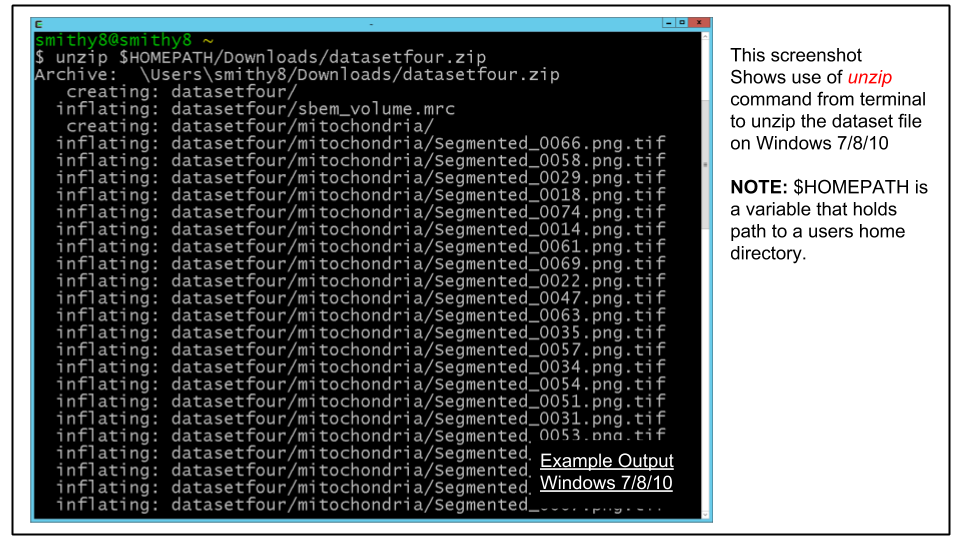
B. Unzip the contents to an easily accessible location:
- For Windows 7/8/10: Unzip the file into a new folder in your home directory. If you used the IMOD cygwin install, the home directory will be C:\Users\<username> (for windows 10 it may be C:\cygwin\home\<username>)
From the cygwin terminal this can be done with this command ($HOMEPATH is an environment variable in Windows set to the user's home directory):
cd ~
unzip $HOMEPATH/Downloads/datasetfour.zip-
For Mac: Unzip the file into a new folder (e.g. /Users/<username>/datasetfour).
-
For Linux: Unzip the file into a new folder (e.g. /home/<username>/datasetfour).
C. If not already open already, open your terminal program
D. Navigate to the directory to which you unzipped the dataset, using the cd command in the terminal:
cd ~/datasetfourE. List the directory's contents using the ls command. you should see one file, sbem_volume.mrc and one directory, mitochondria
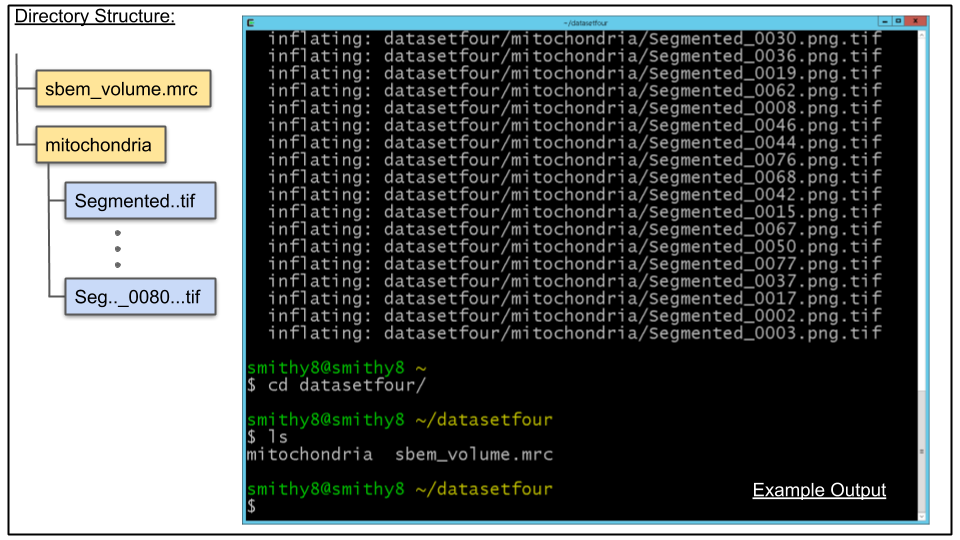
NOTE: If you want to use the mitochondria directory generated from tutorial 3 simply rename the existing mitochondria directory under datasetfour and copy or move the mitochondria directory from datasetthree directory.
Step 2 Convert Mitochondrial Probability Maps to MRC
A. Breakdown of contents of datasetfour directory:
- sbem_volume.mrc, an MRC stack that has 80 slices
- mitochondria, a directory which contains the CDeep3M probability maps for mitochondria
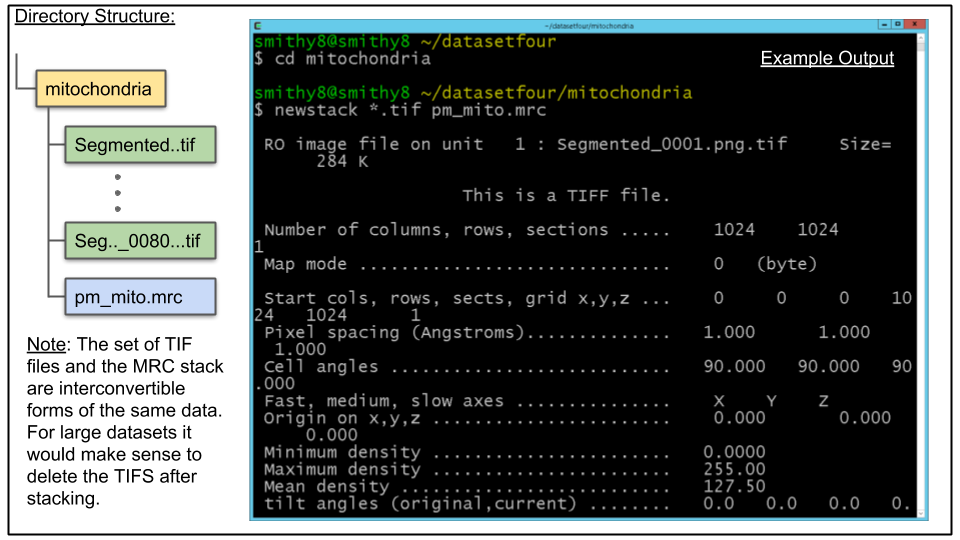
B. The probability maps have already been converted from PNG to TIF. As of version 4.7 most IMOD programs can process TIF images in the same manner as MRC files. Therefore, we can directly append the TIF files to a single MRC stack. Use the following commands:
cd mitochondria
newstack *.tif pm_mito.mrc
This will append all of the newly made TIF files, in alphanumerical order, to a new MRC stack named in the above case pm_mito.mrc
Step 3 Alter the Header Info of Converted MRC Stack
A. View the header information of the raw image stack:
header ../sbem_volume.mrcNote that the Pixel Spacing entry is "59 59 400" and the Origin entry is "0 0 0". While the origin is the same as that of the new created pm_mito.mrc, the pixel spacing is not(it is set to "1 1 1" by default). We will correct this using the IMOD program alterheader

B. To correct pixel spacing enter the following at the command line:
alterheader -del "59 59 400" pm_mito.mrc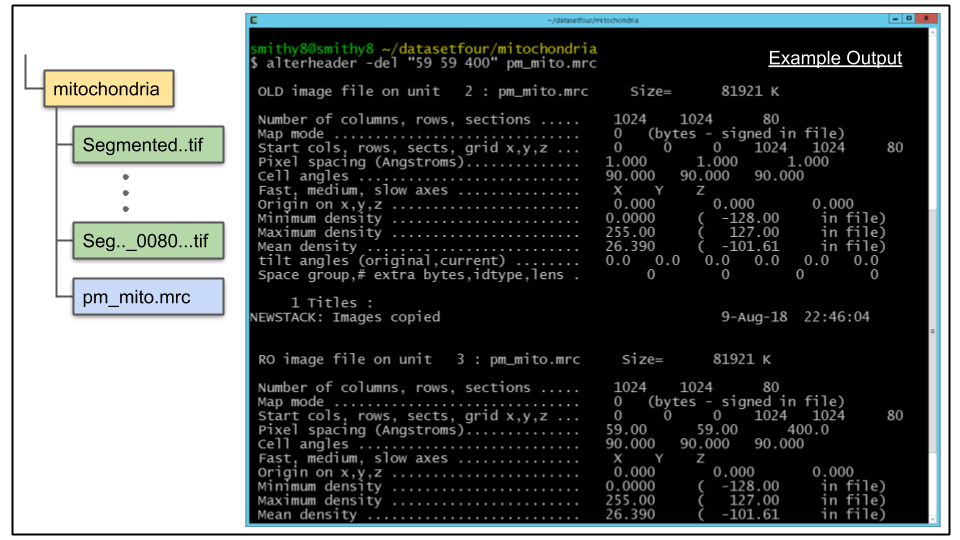
A. For this tutorial, we will apply a single-level threshold to the probability maps and generate contours around the output. The IMOD program imodauto is used to do this. The following imodauto arguments are useful to use and understand for this purpose:
- -h Pixel intensity value for the high threshold. Contours will be drawn about all the pixels above this value. Since the data are 8-bit, values ranging from 0 to 255 are valid.
- -u Uses unscaled pixel intensity values for the threshold cutoff. Highly recommended.
- -R Proportion of points to remove from the final contours. This can have the effects of producing smoother contours and reducing file size. Useful values typically range from 0.25 - 0.5.
- -k Smooths the probability map stack with a kernel filter whose Gaussian sigma is given by the entered value.
-
-z Set the zscale for the model. The zscale is a factor that compensates for 3 dimensional data that is sampled at a different z resolution than the x-y plane data. In the dataset used for this tutorial x-y is 5.9nm a pixel and z is 40nm so the ratio is roughly 40/5.9 = 6.78. This value can also be adjusted in
3dmodGUI under the menu Edit -> Model -> Header
For these data, a good segmentation can be achieved using a 50% cutoff for pixel intensity (= 128).
Run the following command which will create an MRC model file named seg_mito.mod:
imodauto -h 128 -z 6.78 -u pm_mito.mrc seg_mito.modB. Though the above command will yield good output, it is worthwhile to take some time experimenting with different combinations of arguments and visualizing how they affect the output. For example, increasing the high threshold value will reduce false positives, but may also increase false negatives by being too stringent. Similarly, check how the -R and -k arguments change the output.
To view the results run the following command 3dmod command:
3dmod ../sbem_volume.mrc seg_mito.mod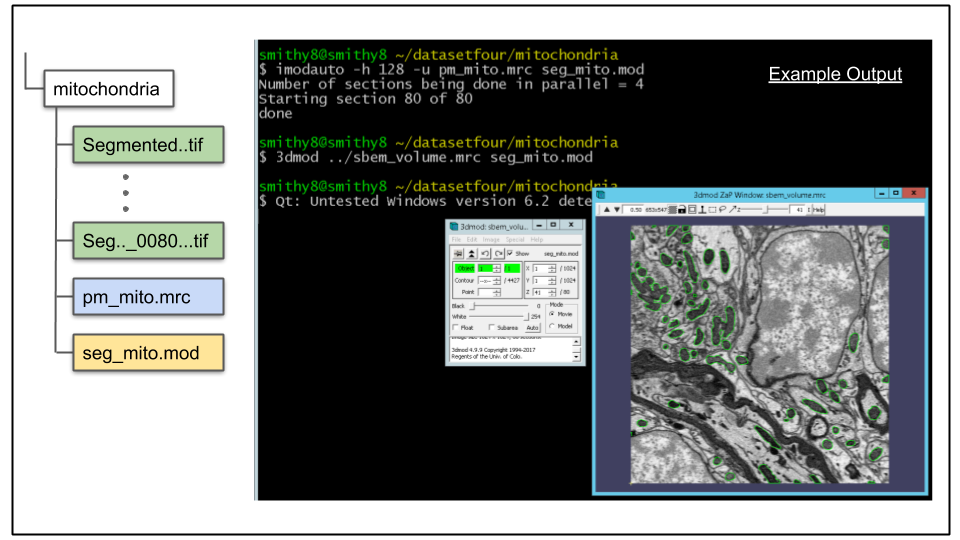
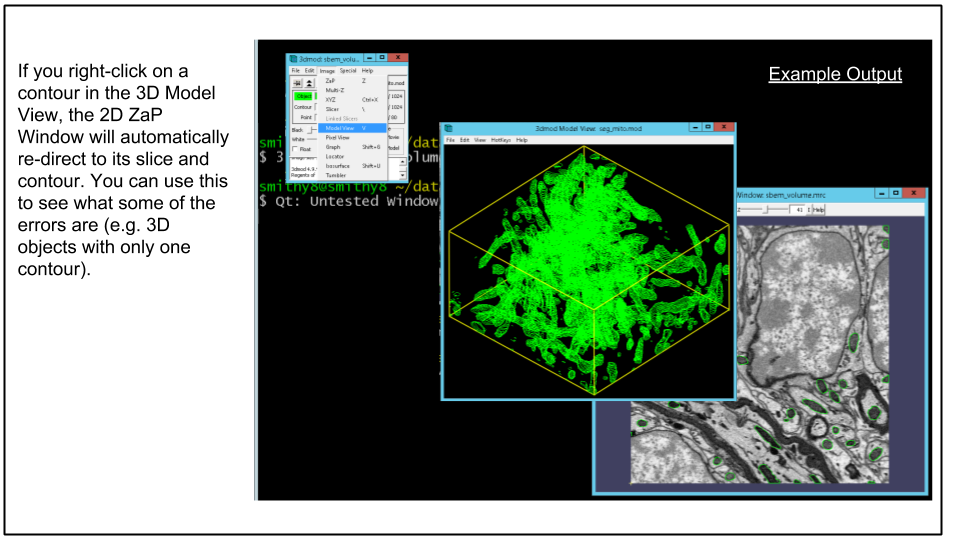
C. Showing the contours in model view.
To launch model view from the 3dmod GUI click Image -> Model View via menu or press the 'v' hotkey. An example of this can be seen below.
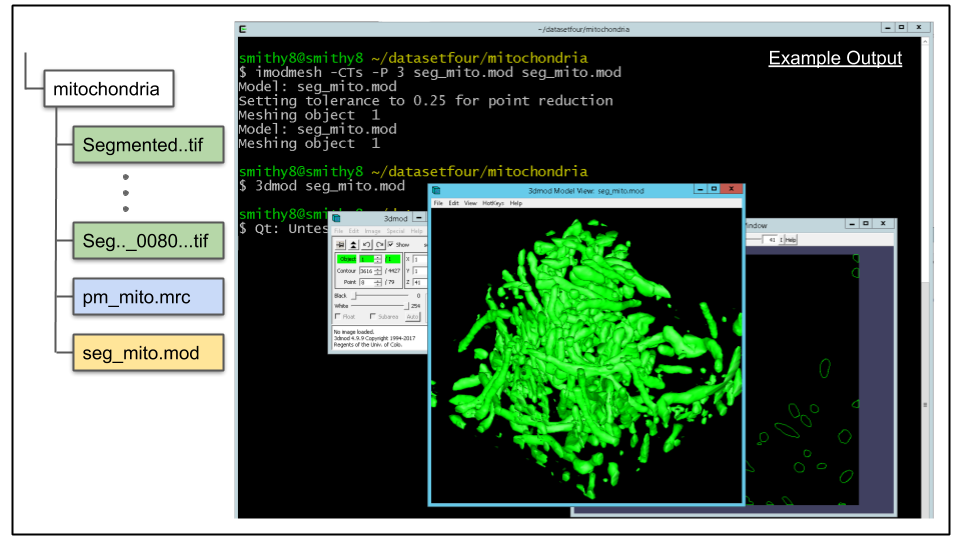
A. imodauto outputs all contours as part of one, massive object. This is not desirable, ideally each spatially separated mitochondrion to be its own object. To achieve this, a mesh for the model file needs to be generated. This is done using the program imodmesh There are man optional arguments for imodmesh, and it is a good idea to review them on the program's man page. For now, let's mesh the contours using the following command:
imodmesh -CTs -P 3 seg_mito.mod seg_mito.modThe most important options to note here are the -s and -P arguments. The combination of both will cause meshes to be made across slices of the object that have missing data. An object containing a slice with missing data is common, and may occur due to artifacts of the imaging process. The integer value entered after the -P flag tells imodmesh to skip up to three sections when forming meshes. If this value is too large, there is a risk of erroneously connecting spatially separated objects that shouldn't be joined together (false merge error).
B. Load model in 3dmod to view mesh. Load the model to view the mesh by running this command:
3dmod seg_mito.modClick v (or via menu Image -> Model View) to bring up model view as seen below.
When done viewing exit 3dmod
A. Once the single object has mesh information, it can be split into separate objects based on 3D connectivity by the imodsortsurf command. Let's run imodsortsurf on the data, using the -s argument to create new objects which will be written to a new file created by imodsortsurf which we will name seg_mito_sort.mod
imodsortsurf -s seg_mito.mod seg_mito_sort.modB. Once the process has completed, the split objects can be visualized using 3dmod. But first, the objects need to be re-meshed to update the mesh info to reflect the colors of the new, sorted objects:
imodmesh -CTs -P 3 seg_mito_sort.mod seg_mito_sort.mod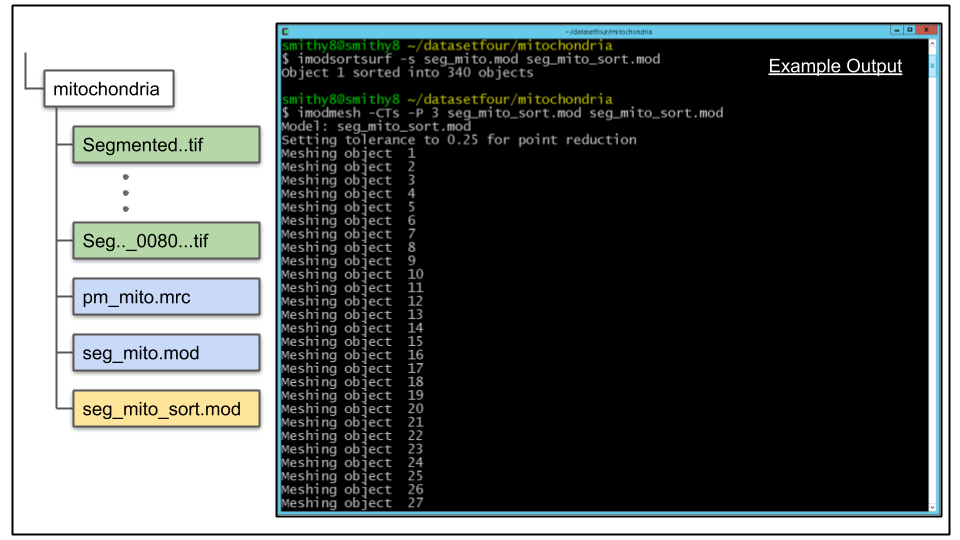
C. Open the model file in 3dmod and press 'v' hot key to display the 3dmodel:
3dmod seg_mito_sort.mod
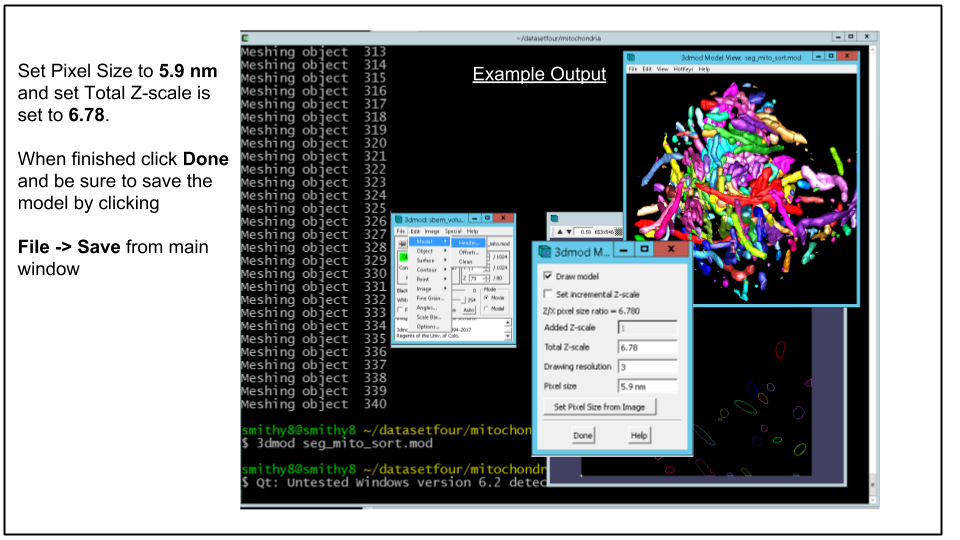
D. Adjust Model Pixel Size.
Although the z-scale was set properly earlier to 6.78 with -z flag passed to imodauto, the xy pixel size needs to be adjusted. This can be done via the main 3dmod window by clicking Edit -> Model -> Header and clicking Set Pixel Size from Image (if MRC file was loaded with model) or by manually entering 5.9 nm (yes type the nm) in the Pixel Size text field. When done hit Done
Be sure to save the model by clicking File -> Save Model from main 3dmod window and exit 3dmod
Using the suggested parameters, the above step split the model into hundreds of putative mitochondria. Some of these objects are false positives, and can be removed by applying some simple morphological filters. As a starting point, we'll remove all objects that have less then a certain number of contours.
Doing this through the IMOD GUI is very tedious, and IMOD doesn't have any command line programs to automate this process. We will use a set of Python classes to automate this filtering on the CDeep3M instance spun up earlier. First we need to copy our model file to the CDeep3M instance:
A. Copy the file to the CDeep3M instance:
NOTE: This tutorial assumes $cdeep3mhost variable is set, Click here for instructions
scp -i ~/.ssh/id_rsa seg_mito_sort.mod ubuntu@$cdeep3mhost:/home/ubuntu/.B. Connect to CDeep3M instance
ssh -i ~/.ssh/id_rsa ubuntu@$cdeep3mhost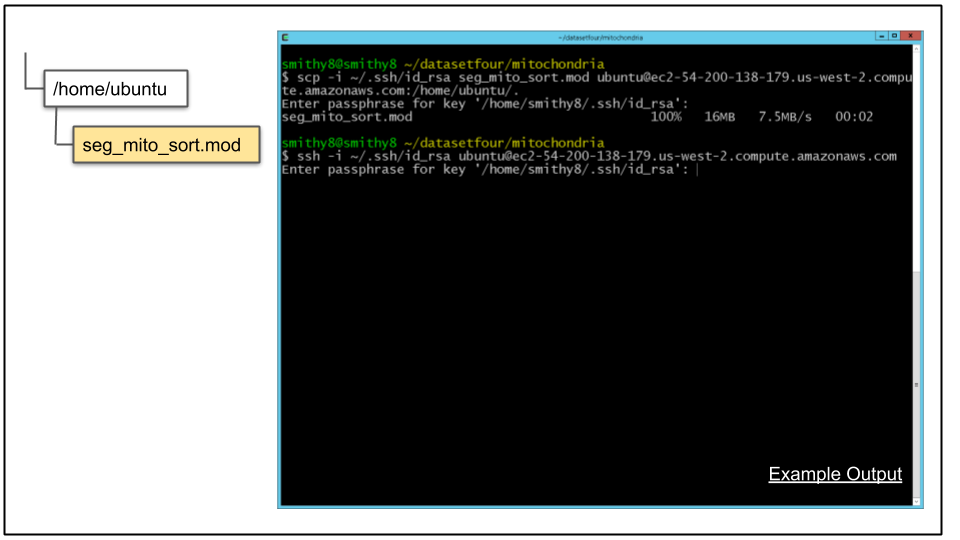
C. Clone the PyIMOD repository from Github:
git clone https://github.com/CRBS/PyIMOD.gitD. Start Python, import PyIMOD, and perform some basic filtering of the model file:
python
import PyIMOD
mod = PyIMOD.ImodModel('seg_mito_sort.mod')
mod.filterByNContours('>',3)
PyIMOD.ImodWrite(mod, 'seg_mito_sort_filter.mod')
exit()
Starting with the 'import PyIMOD' line, this will import PyIMOD module you cloned. Next, the model file you copied to the CDeep3M instance is read into an ImodModel Python object. The next line performs the filtering. This particular commadn will keep all objects taht have greater then 3 contours, and remove all objects that have less then or equal to 3 contours. This is a very quick and dirty way to filter out potential false positives. Finally, the filtered model file is written to a new file under a different name, and then Python is exited.
E. Exit from Cdeep3M instance by typing:
exitAnd copy the filtered model file back to your computer. Be sure to include a space and the period character at the end of the scp command below:
scp -i ~/.ssh/id_rsa ubuntu@$cdeep3mhost:/home/ubuntu/seg_mito_sort_filter.mod .F. Re-mesh the model file:
imodmesh -CTs -P 3 seg_mito_sort_filter.mod seg_mito_sort_filter.modG. Open the model file using the 3D model viewer. Note the differences between this model and the unfiltered version.
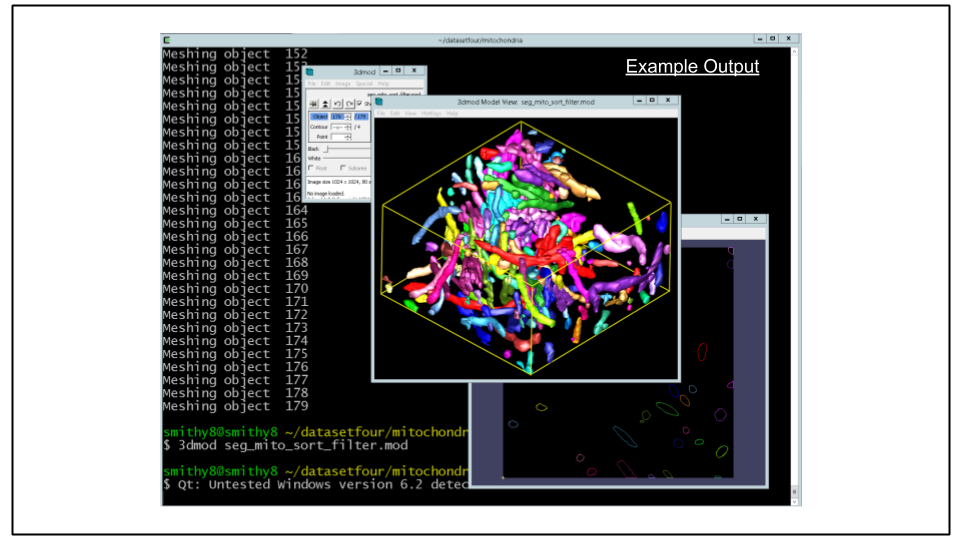
NOTE: If you have some extra time at the end of the demo, you can try experimenting with some of the different filters in PyIMOD. Instance of filtering by number of contours, you can, for example, filter by object volume using mod.filterByVolume
To remove all objects with volumes less then 0.01 um^3, for example, you would use:
python
import PyIMOD
mod = PyIMOD.ImodModel('seg_mito_sort.mod')
mod.filterByVolume('>=', 0.01)
PyIMOD.ImodWrite(mod, 'seg_mito_sort_filter.mod')
exit()A. Ensure that the model file has the proper header information (it should have been done in Step 6 D ). With the model file open in 3dmod, go to Edit -> Model -> Header.
Under Pixel Size, verify the correct lateral pixel size, which is 5.9 nm for this dataset.
Under Total Z-Scale, verify the ratio of the axial pixel size to the lateral pixel size. For this dataset, this ratio is 40 / 5.9 or 6.78.
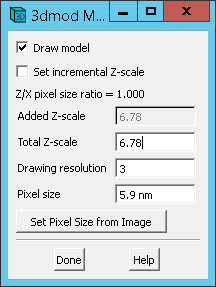
Be sure to save the model via File -> Save Model if above values needed to be set.
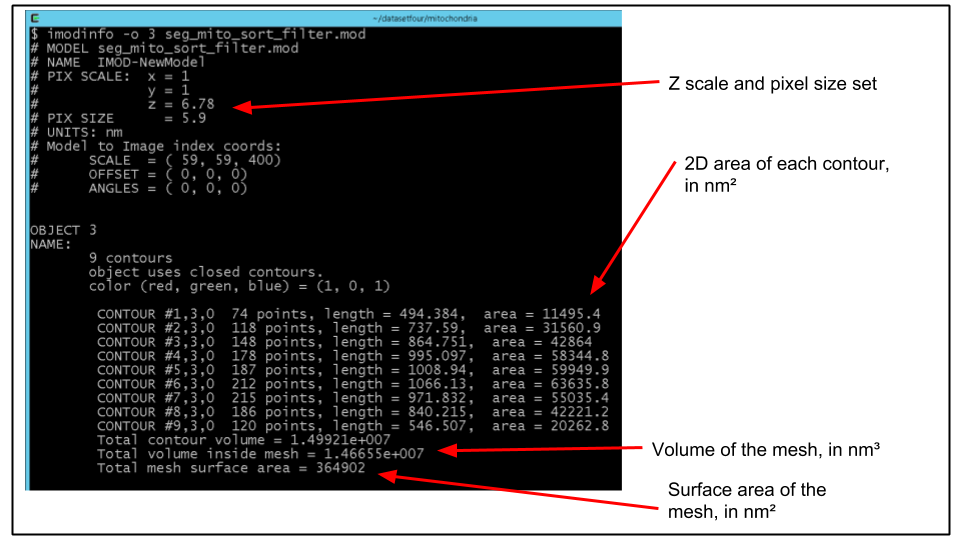
B. Choose the object number corresponding to a mitochondrion (e.g. 3). We can print a detailed listing of metircs of this object using the program imodinfo. Run imodinfo with the -o flag specifying the appropriate object number, for example:
imodinfo -o 3 seg_mito_sort_filter.modThe output should look like the following:
C. Of course, it would be nice to get the volume of say, every mitochondrion, printed out in a format that can be easily improted to a program like Excel.
We can do this on the command line using a unix pipe | to send the output of imodinfo to the grep command which selects lines matching text passed to it. We then pipe that output to the cut command which "cuts" out sections of text in each line it receives.
Run the following:
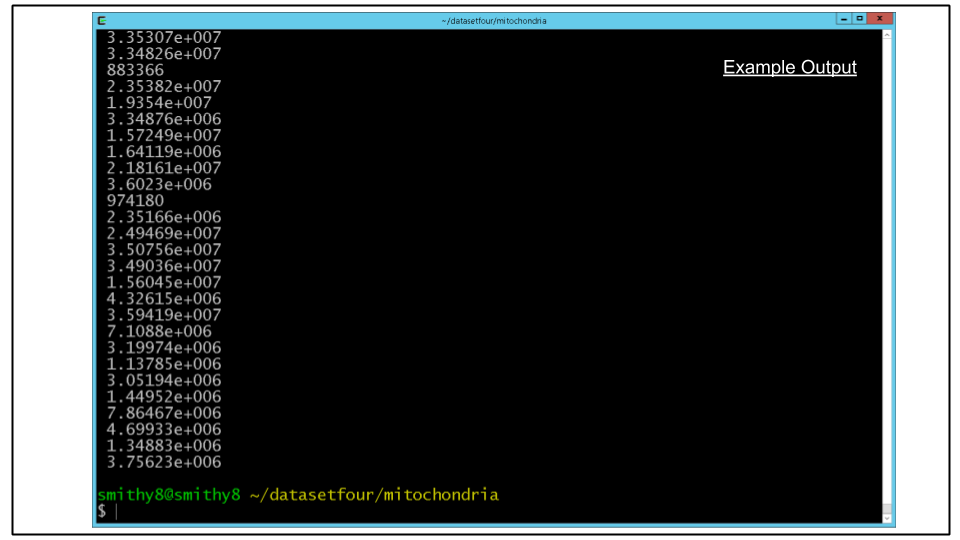
imodinfo seg_mito_sort_filter.mod | grep 'volume inside mesh' | cut -d '=' -f2For the surface area, the analogous command would be:
imodinfo seg_mito_sort_filter.mod | grep 'surface area' | cut -d '=' -f2You should see an output to the terminal resembling the screenshot below, in which each line corresponds to the metric of each individual mitochondrion.
A. It is important to point out that one can use imodauto to attempt to segment features directly from the MRC file.
Here we are using the -l flag (lower case L) to extract features darker then X pixel value:
- -l Pixel intensity value for the low threshold. Contours will be drawn about all pixels below this value. Since the data are 8-bit, values ranging from 0-255 are valid.
For this dataset a cutoff of 15 was picked by moving the contrast sliders in IMOD graphical interface (Note: the -u is missing to disable raw thresholding) and output will be written to seg_thresh.mod
imodauto -l 15 ../sbem_volume.mrc seg_thresh.modB. Once a model file has been created the same process applied earlier to the .mod files can be used to create 3D models. This method can work very well on data that stands out (very dark or very bright) obviating the need for more complex segmentation approaches.
Run the following to view the results in 3dmod:
3dmod ../sbem_volume.mrc seg_thresh.mod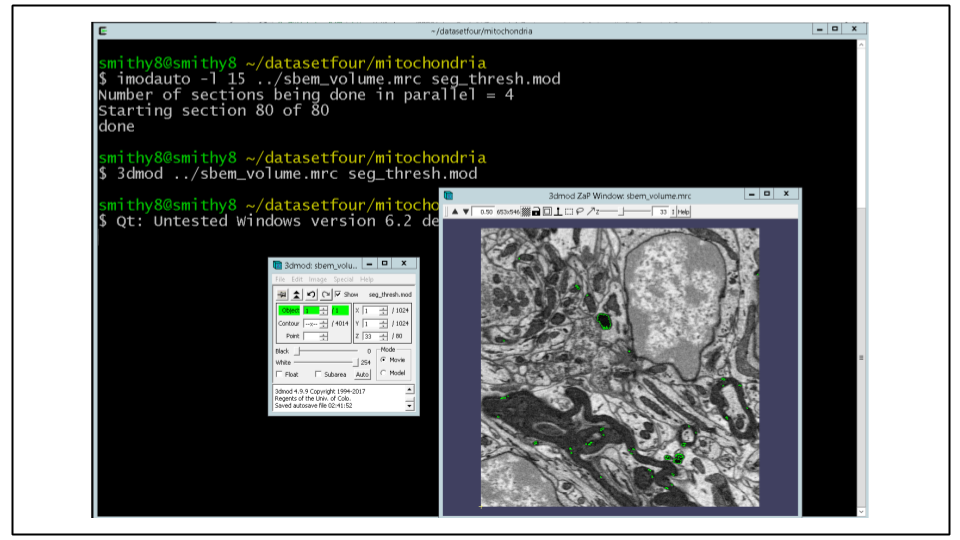
Since no automatic segmentation is perfect, the quantified results are, of course, not perfect.
The degree to which the automatic results need to be corrected depends upon the goals of your experiment and what you want to quantify.
For example, if you are only looking to quantify a metric like mitochondrial volume fraction (the sum volume of all mitochondria divided by the volume of the tissue), the purely automatic results may be accurate to within a few percent and may be sufficient.
If you are looking to quantify individual mitochondrial metrics, like the average mitochondrial volume, you may need to proofread the automatic output more carefully.
A. Let's spend the remaining time using the IMOD segmentation tools we learned about in the first session to correct our automatically generated model.
We can also spend time re-running some of the steps to check for their effects on the output.
B. Importing 3D model into Blender is another optional task
Click here for instructions on how to import the model created into Blender
Congratulations you have finished the tutorials!!!
Be sure to shutdown your CDeep3M instance to avoid additional charges: