Dart stays 99% cpu all the time #2219
Comments
|
The Dart/Flutter extensions should not activate in VS Code unless you open a Flutter/Dart project (or unless you have just installed them - VS Code will eagerly activate them at install time). If you can reproduce this (closing VS Code, terminate any Dart process, then re-open VS Code without opening a Dart project) let me know and we can examine the logs to find the extension activation reason. Can you run |
|
I have issue when I open whole Home directory (for bash env edits), where in some subdirectories have some dart/flutter projects. After VSCode quitting I found zombie dart process what consume some 99%. |

If you open your home directory, then the Dart analyzer is going to try and analyze your entire home directory. If this is very large , it could take a long time. If you have symlinks that cause loops, then it may get stuck analyzing forever. I don't know if there's a great solution to this besides only opening the files you need to edit from the home directory directly. |
Sure, I know. Better way is use workspace with disabled extension, also good to use |
|
Yeah, those are options too. @nkoroste are you still seeing this issue? Can you get the output of |
|
|
|
Can you confirm how big the folder you have open is? It looks like the Python language server is also consuming significant CPU - is it a big tree? |
|
|
|
If there's no Dart at all, then the extension should not be activating. If it's a large workspace, you could be hitting microsoft/vscode#73656 where VS Code automatically activates unrelated extensions (that use To confirm this, you could run Developer: Show Logs and select Extension Host and look for a line like this:
the |
|
Yep, this looks like microsoft/vscode#73656. The issue is that you're opening a large workspace and VS Code is unable to check whether it contains any Dart/pubspec before timing out (7 seconds), so it pre-emptively activates all of the extensions that might be needed. This results in language servers being started, which then also scan the whole workspace (because they think the workspace contains their language). I don't know of a good fix - VS Code's timeout seems counter-productive IMO - it's designed to improve performance, but seems to make it worse. While we could scan the workspace ourselves before spawning the language server, this is doing exactly the work VS Code was trying to avoid (and doing it a second time, so it'll take 7 seconds longer overall than if VS Code had finished it). I would recommend adding a 👍 and/or comment to that issue - so far it's not had much activity. |
|
I'm seeing the issue of multiple dart zombie processes on Linux, but for me it's when builds fail (in my case, the error being 'unable to generate build files') that it leaves the dart processes behind. After 5 failed build attempts:
|

|
@MarcusTomlinson I don't think that's the same issue as this, those all have 0% CPU. Could you file another issue, and include the full command line for the processes are being left behind? Thanks! |
|
So do i (我也一样) |

|
I think there may be two issues here:
I don't know that 2 is an issue - but I'm guessing it may be from these reports. If someone can reliably reproduce the CPU remaining high after many minutes (and they have not opened a huge folder, like their entire user profile) then I'd be interested in an analysis server instrumentation log (note: this log may include parts of your source files!). |
|
@DanTup I believe 2 is an issue for me. The analysis log file gets huge pretty fast (multi GB) and as you point out may contain confidential information. How can I get such a log file to you without making it public? |
|
Also, I posted the relevant part of the log file here, along with the code that seems to be triggering the problem: |
|
@SteveAlexander you probably don't need to send the whole thing - if it's stuck in a loop or something (which I suspect it could be), it might be obvious from just the last few tends/hundreds of lines. You can email to me at logs@dartcode.org (but still ensure there's nothing confidential in there) - though I think it has around a 25MB limit (shouldn't need more than that from the end though - but the first hundred lines or so may also be useful as it has startup stuff). One thing that has caused issues like this in the past is circular symlinks (which has resulted in the server walking down the tree forever). I'm not sure if that's handled correctly yet. |
|
@SteveAlexander ah yes, I remember that. That does look pretty suspicious to me. It seems like something is being duplicated a lot (whether it's in a loop, or just growing very large, I'm not sure - though that it was able to start writing the JSN makes me think it must just be large). I don't know if it's the same issue as this original case (I think your problem could be triggered by the codegen or something?), but if you're able to strip your project down to something you can share (on that issue), I can try to reproduce here where I could step through the server code or add more logging. |
|
I think there have been a few issues discussed here, but I think they're all now covered by other issues: VS Code activating the Dart extension without a Dart project open was a regression in vS Code that's fixed for the next version (with the fix available in Insiders now). The high CPU issue and huge log files has been raised in the SDK repo at dart-lang/sdk#43765. To avoid confusion, I'm going to close this one - but if you're having an problem other than these, please file separate issues for them. Thanks! |
How could i do that? |
|
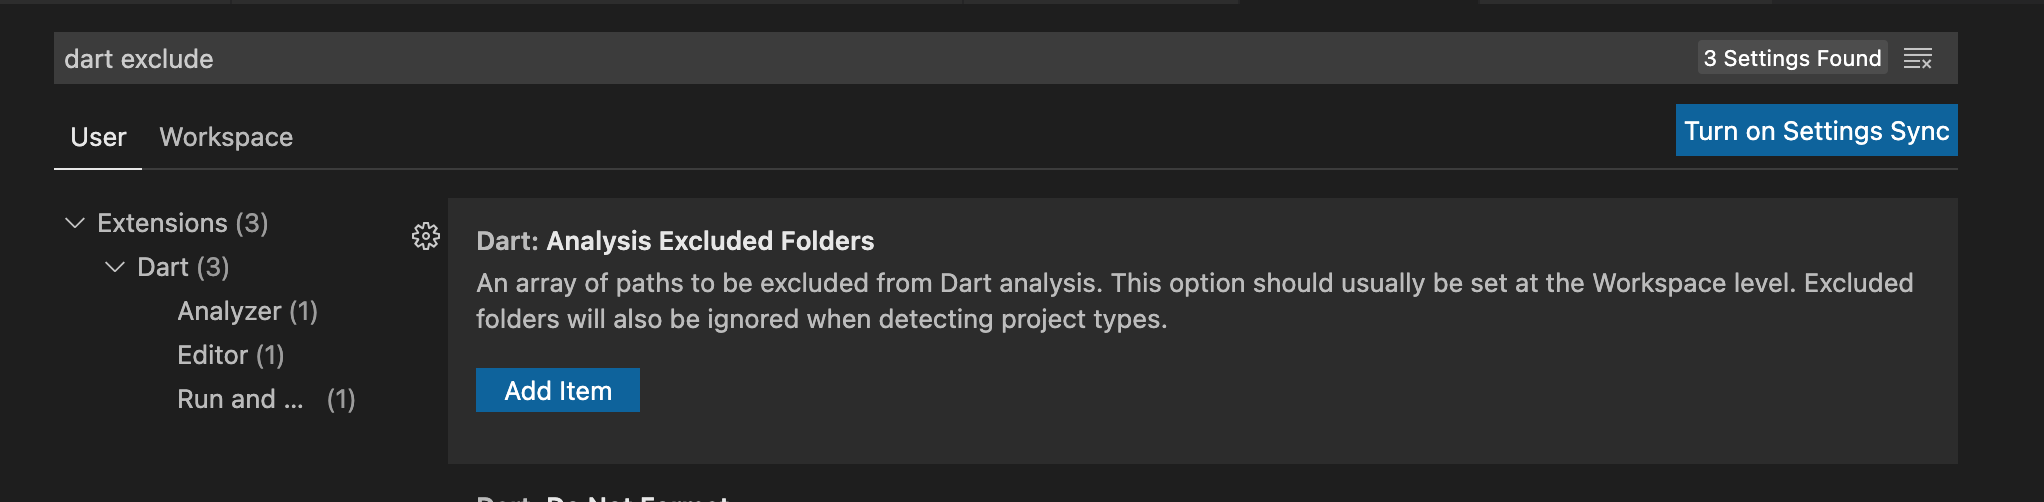
@mahmoudatef955 it's in the VS Code settings:
|
|
Thanks for your reply.
How can I do it in Intellij?
…On Wed, Feb 2, 2022 at 12:47 PM Danny Tuppeny ***@***.***> wrote:
@mahmoudatef955 <https://github.com/mahmoudatef955> it's in the VS Code
settings:
[image: Screenshot 2022-02-02 at 10 46 45]
<https://user-images.githubusercontent.com/1078012/152139482-4c5ff849-8ef2-4d2d-8a60-4104be8ddfd5.png>
—
Reply to this email directly, view it on GitHub
<#2219 (comment)>,
or unsubscribe
<https://github.com/notifications/unsubscribe-auth/AEN7TAASSV6PTPDC5D2QGMLUZEDTNANCNFSM4KG3C7TQ>
.
Triage notifications on the go with GitHub Mobile for iOS
<https://apps.apple.com/app/apple-store/id1477376905?ct=notification-email&mt=8&pt=524675>
or Android
<https://play.google.com/store/apps/details?id=com.github.android&referrer=utm_campaign%3Dnotification-email%26utm_medium%3Demail%26utm_source%3Dgithub>.
You are receiving this because you were mentioned.Message ID:
***@***.***>
|
|
I'm afraid I'm not familiar with IntelliJ, although I would suggest trying to use the https://dart.dev/guides/language/analysis-options#excluding-code-from-analysis |
|
I'll try it, I'm facing this problem while debugging in android only, iOS
is fine . Do you know what might be the problem?
…On Wed, Feb 2, 2022 at 1:05 PM Danny Tuppeny ***@***.***> wrote:
I'm afraid I'm not familiar with IntelliJ, although I would suggest trying
to use the exclude: option in analysis_options.yaml:
https://dart.dev/guides/language/analysis-options#excluding-code-from-analysis
—
Reply to this email directly, view it on GitHub
<#2219 (comment)>,
or unsubscribe
<https://github.com/notifications/unsubscribe-auth/AEN7TAFVWK7BOK75DIUASTTUZEFZLANCNFSM4KG3C7TQ>
.
Triage notifications on the go with GitHub Mobile for iOS
<https://apps.apple.com/app/apple-store/id1477376905?ct=notification-email&mt=8&pt=524675>
or Android
<https://play.google.com/store/apps/details?id=com.github.android&referrer=utm_campaign%3Dnotification-email%26utm_medium%3Demail%26utm_source%3Dgithub>.
You are receiving this because you were mentioned.Message ID:
***@***.***>
|
|
I don't, but things I'd try:
If it only happens with one specific project and not the new one, you should try to find what's different between the two that might be triggering it (or, get the problematic project into a state where you can zip it up and share it). Assuming it's the Dart Analysis Server using up all the CPU, the best repo to file the issue is https://github.com/dart-lang/sdk. |
|
Thanks a lot,I appreciate it.
…On Wed, Feb 2, 2022 at 5:01 PM Danny Tuppeny ***@***.***> wrote:
I don't, but things I'd try:
- ensure you're on the last version of the Flutter SDK
- ensure you have the latest version of the Dart/Flutter plugins for
IntelliJ
- check if it happens with a branch new Flutter project, or only with
this specific project
If it only happens with one specific project and not the new one, you
should try to find what's different between the two that might be
triggering it (or, get the problematic project into a state where you can
zip it up and share it).
Assuming it's the Dart Analysis Server using up all the CPU, the best repo
to file the issue is https://github.com/dart-lang/sdk.
—
Reply to this email directly, view it on GitHub
<#2219 (comment)>,
or unsubscribe
<https://github.com/notifications/unsubscribe-auth/AEN7TAAMHETLOFSFPHNF6ODUZFBOBANCNFSM4KG3C7TQ>
.
Triage notifications on the go with GitHub Mobile for iOS
<https://apps.apple.com/app/apple-store/id1477376905?ct=notification-email&mt=8&pt=524675>
or Android
<https://play.google.com/store/apps/details?id=com.github.android&referrer=utm_campaign%3Dnotification-email%26utm_medium%3Demail%26utm_source%3Dgithub>.
You are receiving this because you were mentioned.Message ID:
***@***.***>
|
Similar to #1114
1155 ?? 19:30.39 /Users/n.korostelev/flutter/flutter/bin/cache/dart-sdk/bin/dart /Users/n.korostelev/flutter/flutter/bin/cache/dart-sdk/bin/snapshots/analysis_server.dart.snapshot --client-id=Dart-Code.dart-code --client-version=3.7.1Pretty sure it because VSCode is open. However, I don't even have an open flutter/dart project but the extension is installed
The text was updated successfully, but these errors were encountered: