We read every piece of feedback, and take your input very seriously.
To see all available qualifiers, see our documentation.
Have a question about this project? Sign up for a free GitHub account to open an issue and contact its maintainers and the community.
By clicking “Sign up for GitHub”, you agree to our terms of service and privacy statement. We’ll occasionally send you account related emails.
Already on GitHub? Sign in to your account
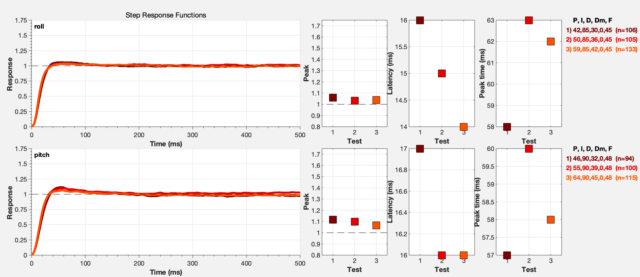
对比展示功能类似阶跃响应分析 可以参考pidtoolbox的展示方式:将多条日志结果按照不同颜色绘制在同一个坐标轴内,这样方便对比。另外如果能读出并展示每条黑盒记录的重点信息,比如p、i、d、Dm、f就更好了。见下图:
The text was updated successfully, but these errors were encountered:
另外还应当关闭step resp图片可拖动的功能
Sorry, something went wrong.
正在开发这个功能,应该很快就能看到了 ;)
在最新的deployment中,在同一pic中显示多条不同颜色trace的功能已经实现
绘图时的y长度应该按照对比域内的settlingmax中的最大值来设定,而不应当使用第一条log中的settlingmax来设定ylenth
No branches or pull requests
对比展示功能类似阶跃响应分析 可以参考pidtoolbox的展示方式:将多条日志结果按照不同颜色绘制在同一个坐标轴内,这样方便对比。另外如果能读出并展示每条黑盒记录的重点信息,比如p、i、d、Dm、f就更好了。见下图:

The text was updated successfully, but these errors were encountered: