Charts
You can create/modify/remove all types of Excel charts with EPPlus. It supports all Excel 2019 chart types with modern chart styling.
To add a chart use the AddChart method or even better its typed variant (in this case AddPieChart).
//Add the piechart
var pieChart = worksheet.Drawings.AddPieChart("crtExtensionsSize", ePieChartType.PieExploded3D);
//Set top left corner to row 1 column 2
pieChart.SetPosition(1, 0, 2, 0);
pieChart.SetSize(400, 400);
var chartRange = worksheet.Cells["A3:B14];
pieChart.Series.Add(chartRange.TakeSingleColumn(1), chartRange.TakeSingleColumn(0));

pieChart.Title.Text = "Extension Size";
//Set datalabels and remove the legend
pieChart.DataLabel.ShowCategory = true;
pieChart.DataLabel.ShowPercent = true;
pieChart.DataLabel.ShowLeaderLines = true;
pieChart.Legend.Remove();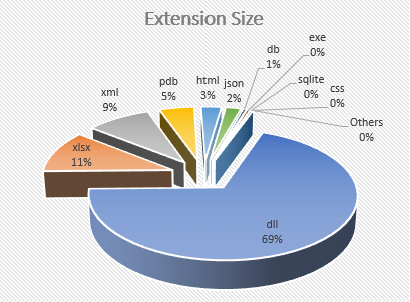
From EPPlus 5.2, all chart types are supported, even newer types like Sunburst Charts and Region Maps.
Here's a piece of code from the sample project showing how to add a Sunburst Chart:
var ws = package.Workbook.Worksheets.Add("Sunburst & Treemap Chart");
var range = await LoadSalesFromDatabase(connectionString, ws);

var sunburstChart = ws.Drawings.AddSunburstChart("SunburstChart1");
var r1 = range.SkipRows(1).SkipColumns(3);
var r2 = range.SkipRows(1).TakeColumns(3);
var sbSerie = sunburstChart.Series.Add(r1, r2);
sbSerie.HeaderAddress = ws.Cells["D1"];
sunburstChart.SetPosition(1, 0, 6, 0);
sunburstChart.SetSize(800, 800);
sunburstChart.Title.Text = "Sales";
sunburstChart.Legend.Add();
sunburstChart.Legend.Position = eLegendPosition.Bottom;
sbSerie.DataLabel.Add(true, true);
sunburstChart.StyleManager.SetChartStyle(ePresetChartStyle.SunburstChartStyle3);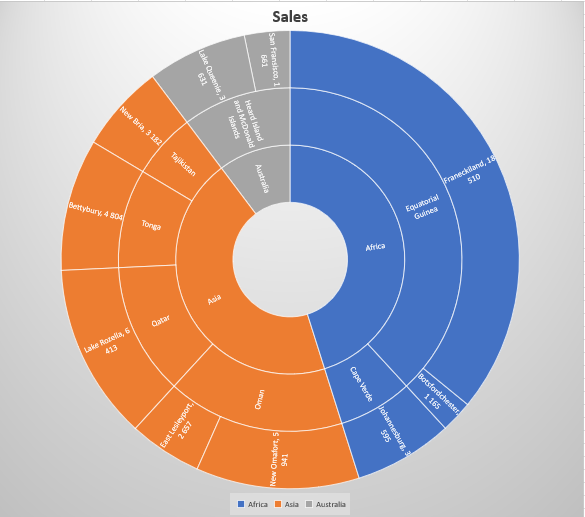
All charts on a worksheet is stored in the Drawings collection. The As properties on Drawing objects helps you to cast the Drawing to its specialized subclass.
// As.Chart.Chart means that we cast all the charts to ExcelChart which is the common base class for all charts
var charts = worksheet.Drawings.Where(x => x.DrawingType == eDrawingType.Chart).Select(x => x.As.Chart.Chart);
foreach(var chart in charts)
{
    var name = chart.Name;
    var chartType = chart.ChartType;
    if(chartType == eChartType.PieExploded3D)
    {
        var myPieChart = chart.As.Chart.PieChart;
        var series = myPieChart.Series;
    }
    // etc
}