Download Example Data Set
For ease of use, we provide a sample data set that you can use for your purposes such as performance evaluation, etc.
** Disclaimer: Please note that all the generated data do not reflect real data. In order to align simulated data with real data, you need to tune all the simulation parameters. It would be helpful if communities could contribute to such efforts.
Examples of data sets can be downloaded from here
- 100vertices-10Kedges: 100 accounts, 10K transactions
- 1Kvertices-100Kedges: 1K accounts, 100K transactions
- 10Kvertices-1Medges: 10K accounts, 1M transactions
- 100Kvertices-10Medges: 100K accounts, 10M transactions
- 1Mvertices-100Medges 1M accounts, 100M transactions For future work, we will generate 1 billion-edge transaction. Based on our performance evaluation with the above data set, we assume that it would take a couple of days to generate such a gigantic data set.
From the banks folder, you can download the following internal/external data sets with gzipped feature CSV files.
Currently three versions of data sets (sub-folders) are available:
-
v2.1(added Feb. 4): Tuned transaction network and models for composite transaction pattern features -
v1.3(added Dec. 16): Improved version ofv1.2so that more graph features improve the model performance -
v1.2(added Dec. 13): Tuned transaction data set so that graph analytics can detect SAR accounts more accurately -
v1.1(added Nov. 27): Baseline of the transaction data sets
In v1.1, v1.2 and v1.3, each data set has 100K accounts and several types of the SAR transaction patterns.
-
bank_a(v1.1only): 100 cycles (3 - 6 SAR accounts for each cycle) -
bank_b(v1.1only): 100 scatter-gather patterns (5 - 10 SAR accounts) -
bank_c(v1.1only): 100 gather-scatter patterns (7 - 11 SAR accounts) -
bank_separated: Transaction network with these above three banks and internal-bank SAR transactions-
bank_a: 20K accounts, 20 cycles -
bank_b: 30K accounts, 30 scatter-gather patterns -
bank_c: 50K accounts, 50 gather-scatter patterns
-
-
bank_mixed: Similar to thebank_separatednetwork, but all SAR transactions are bank-to-bank
CSV files of the transaction graph feature lists are also available (features/bank_*_features.csv.gz).
In the v1.3 datasets, images of histograms for all transaction and graph feature values are also available (see bank_mixed_dist and bank_separated_dist directories under v1.3/features).
The first column (name: account) is account ID, and the other columns are transaction and graph feature values as follows.
| Feature Name | Category | Description |
|---|---|---|
| count | transaction | Total number of transactions |
| sum_amount | transaction | Total transaction amount |
| in_count | transaction | Total number of received transactions |
| in_amount | transaction | Total received transaction amount |
| out_count | transaction | Total number of received transactions |
| out_amount | transaction | Total received transaction amount |
| ego1_num | 1-hop egonet | Number of SAR accounts in the 1-hop ego network |
| ego1_prop | 1-hop egonet | Proportion of SAR accounts in the 1-hop ego network |
| ego2_num | 2-hop egonet | Number of SAR accounts in the 1-hop and 2-hop ego network |
| ego2_prop | 2-hop egonet | Proportion of SAR accounts in the 1-hop and 2-hop ego network |
| pr | PageRank | PageRank score (Each vertex sends its score to neighbors with damping factor=0.85 and receive and accumulate scores, and then update its own score.) |
| lp | Label Propagation | Propagate labels (scores) to neighbor through edges. SAR accounts have a fixed score 1.0, and others have initially 0.0. Update scores of non-SAR accounts from edge weight as threshold. |
| u_sar | undirected cycle | The maximum proportion of SAR accounts in cycles |
| u_length_min | undirected cycle | The minimum length of involving cycles |
| u_length_avg | undirected cycle | The average length of involving cycles |
| u_length_max | undirected cycle | The maximum length of involving cycles |
| u_amount_min | undirected cycle | The minimum total amount of involving cycles |
| u_amount_avg | undirected cycle | The average total amount of involving cycles |
| u_amount_max | undirected cycle | The maximum total amount of involving cycles |
| u_period_min | undirected cycle | The minimum period (days) of involving cycles |
| u_period_avg | undirected cycle | The average period (days) of involving cycles |
| u_period_max | undirected cycle | The maximum period (days) of involving cycles |
| u_date_order | undirected cycle | 1.0 if at least one of involving cycles are in chronological order, 0.0 otherwise. |
In the v2.1 data set, bank-to-bank transaction network (bank_mixed)
and internal-bank transaction networks (bank_a, bank_b and bank_c) extracted from the bank_mixed are available.
-
bank_mixed: 20K accounts (753 SAR accounts), 885,744 transactions (807 SAR transactions) with the following SAR typologies- 20 cycles: 3 - 6 SAR accounts (members), 10 - 30 days (simulation steps), 2,700 - 3,000 transaction amount
- 30 scatter-gather: 5 - 10 SAR accounts (3 - 8 intermediate accounts), 10 - 30 days, 2,700 - 3,000 transaction amount
- 50 gather-scatter: 7 - 11 SAR accounts (3 - 5 originators and beneficiaries), 10 - 30 days, 2,700 - 3,000 transaction amount
- The number of accounts and transactions of internal-bank transaction networks are following.
-
bank_a: 4K accounts, 34,976 transactions -
bank_b: 6K accounts, 80,502 transactions -
bank_c: 10K accounts, 222,260 transactions
The following additional features of composite patterns are also available in the v2.1 data set.
Note: In the feature sets of scatter-gather and gather-scatter patterns, the prefix "sg_" or "gs_" is added for the following feature names respectively.
| Feature Name | Description |
|---|---|
| num_accts | Number of total involving accounts in the composite pattern |
| num_txs | Number of total transactions in the composite pattern |
| min_amount | Minimum transaction amount |
| max_amount | Maximum transaction amount |
| avg_amount | Average transaction amount |
| sum_amount | Total transaction amount |
| all_period | Overall transaction period |
| diameter | Diameter of the pattern subgraph (number of transaction hops from the first accounts to the last accounts) |
| all_amount_diff | Difference of the amount of transactions from the first accounts and transactions to the last accounts |
| all_amount_ratio | Ratio of the total transaction amount of the first accounts sent divided by that of the last accounts received |
| all_date_diff | Difference of the transaction date between the first account sent and the last account received |
| amount_ordered | If transactions amounts are decayed for all intermediate accounts, the value is 1. Otherwise, it is 0. |
| date_ordered | If transactions of all intermediate accounts are chronologically ordered, the value is 1. Otherwise, it is 0. |
| in_count | Number of incoming transactions the account received |
| out_count | Number of outgoing transactions the account sent |
| in_amount | Total amount of incoming transactions |
| out_amount | Total amount of outgoing transactions |
| acct_amount_diff | Difference of the total amount of incoming and outgoing transactions (in_amount - out_amount) |
| acct_amount_ratio | Ratio of the total amount of incoming and outgoing transactions (in_amount / out_amount) |
| acct_period | Overall period of transactions |
| acct_date_diff | Difference of the date between incoming and outgoing transactions |
| depth | Relative distance of this account from the first originator account (first originator: 0.0, last beneficiary: 1.0) |
Here is a list of example data set specially for performance evaluation. For your reference, we also added elapsed time to generate these data so that it would be helpful if you could execute AMLSim with your parameters.
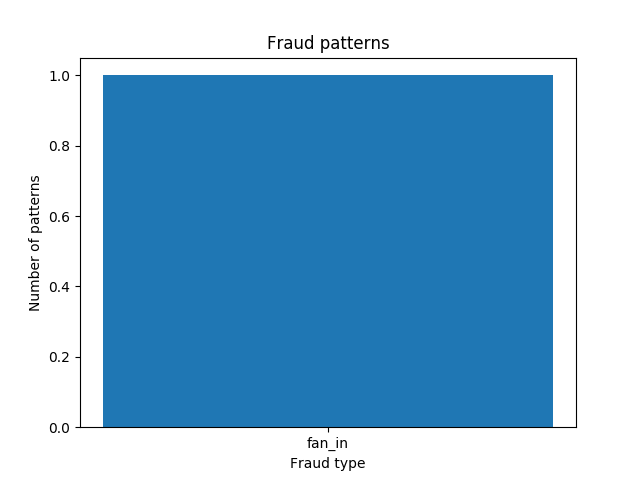
| Data Name | File Size (7-Zip) | Number of Vertices (Accounts) | Number of Edges (Transactions) | Number of Fraud Patterns (fan_in + fan_out + cycle) | AMLSim Execution Time (s) |
|---|---|---|---|---|---|
| 100vertices-10Kedges | 149K | 100 | 10,000 | 1 (1 + 0 + 0) | 0.848 |
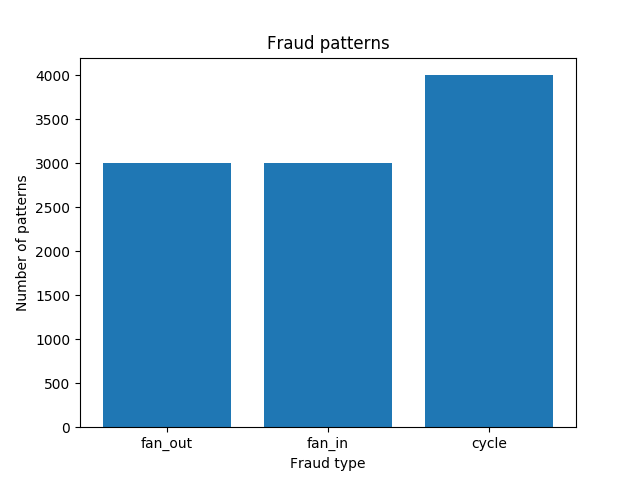
| 1Kvertices-100Kedges | 507K | 1,000 | 100,000 | 10 (3 + 3 + 4) | 13.594 |
| 10Kvertices-1Medges | 4.7M | 10,000 | 1,000,000 | 100 (30 + 30 + 40) | 201.505 |
| 100Kvertices-10Medges | 71MB | 100,000 | 10,000,000 | 1,000 (300 + 300 + 400) | 2100.421 |
| 1Mvertices-100Medges | 976MB | 1,000,000 | 100,000,000 | 10,000 (3,000 + 3,0000 + 4,000) | 18040.666 |
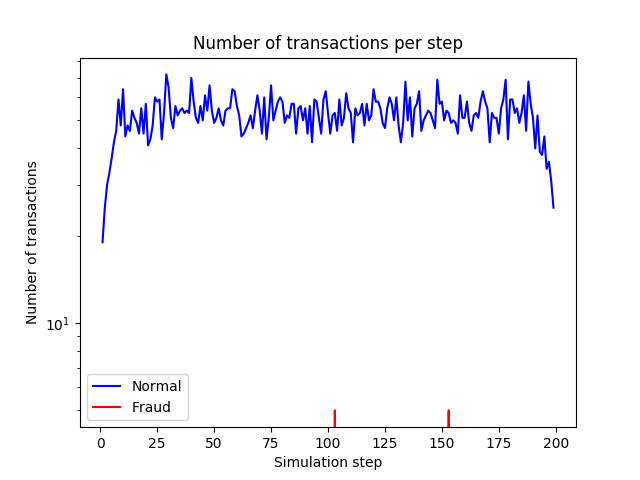
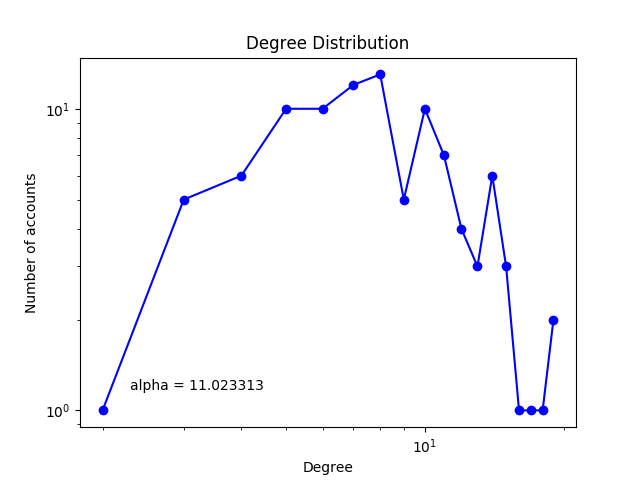
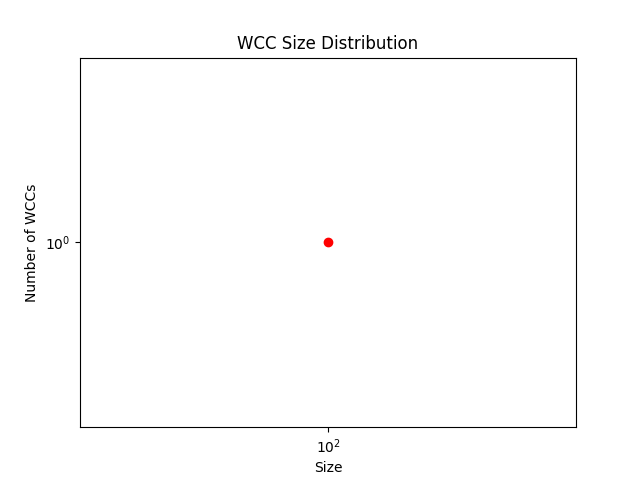
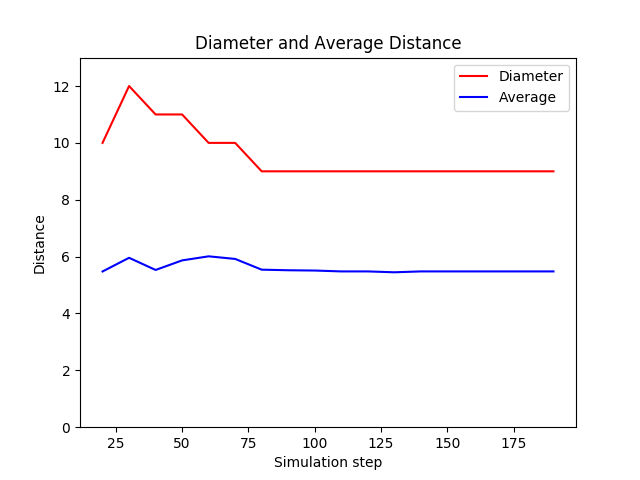
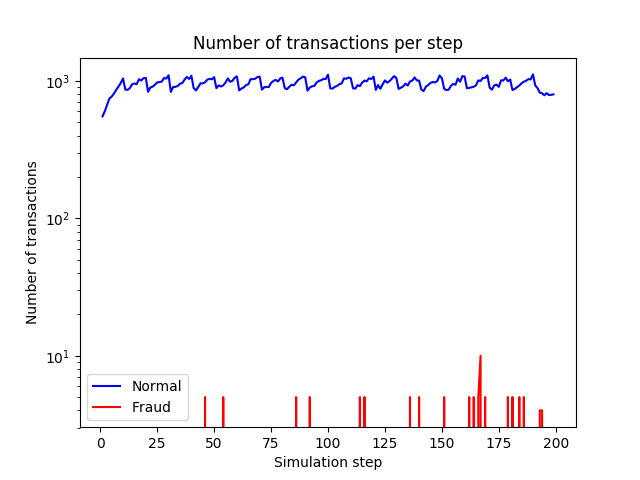
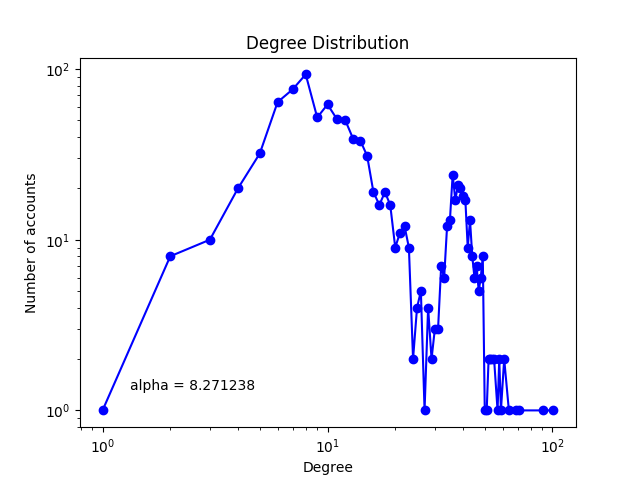
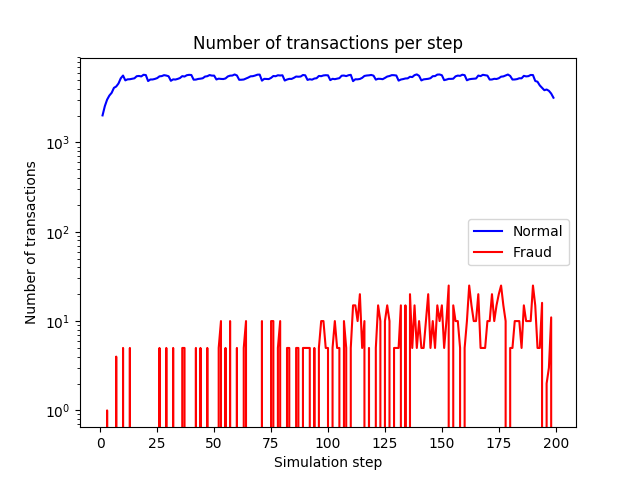
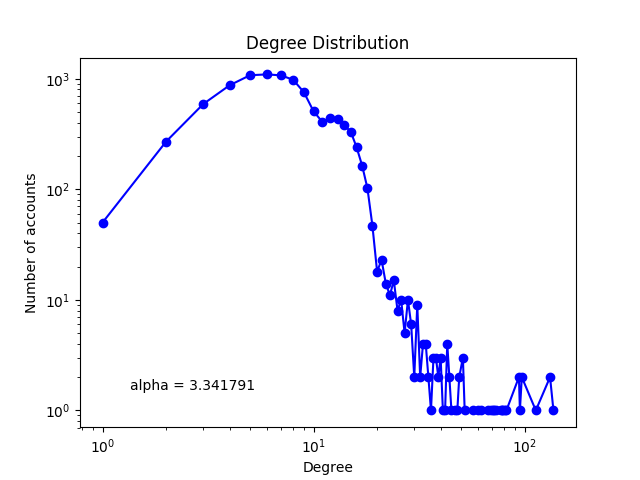
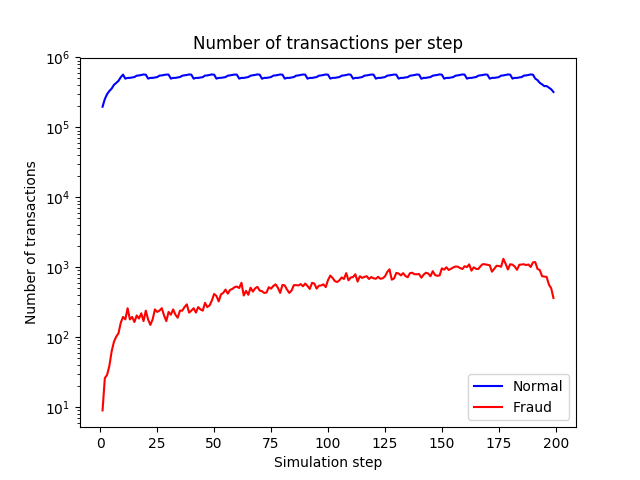
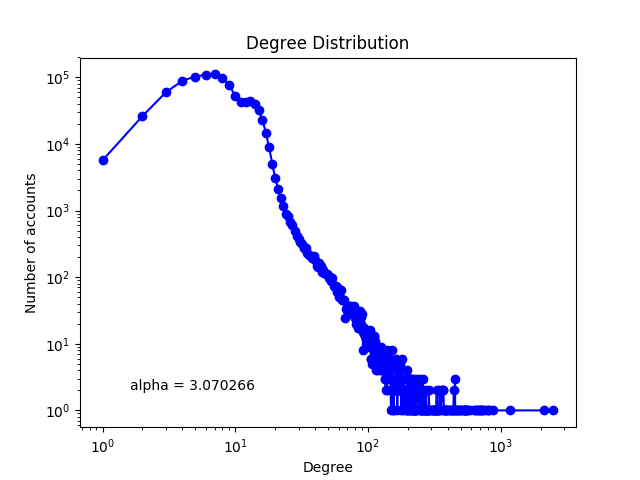
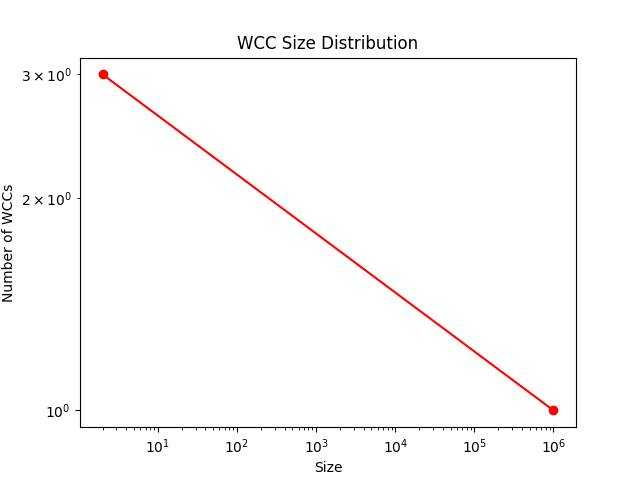
| Number of Transactions for Each Step | Account Degree Distribution | WCC Size Distribution |
|---|---|---|
 |
 |
 |
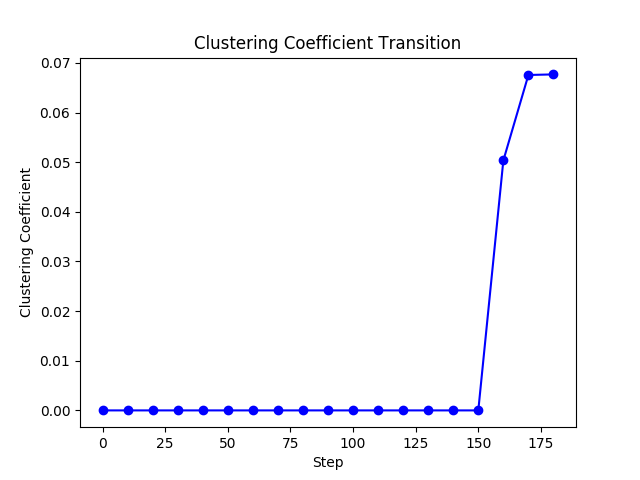
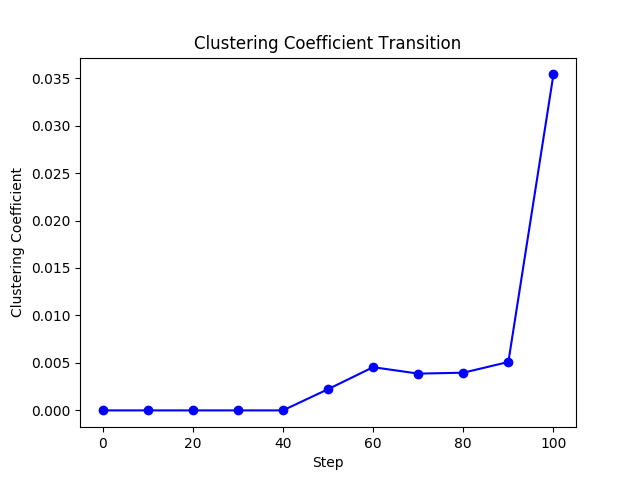
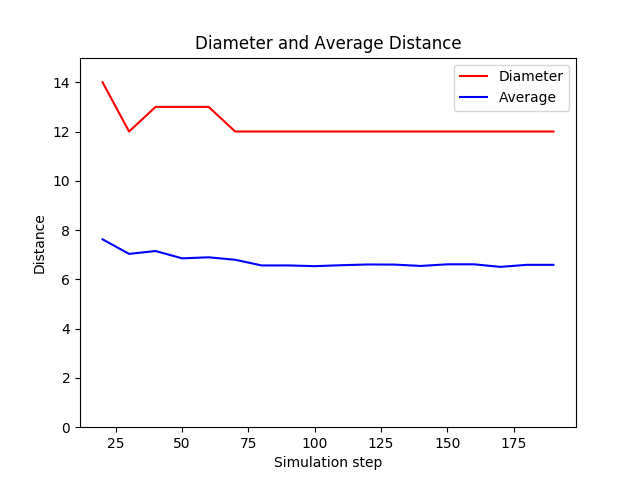
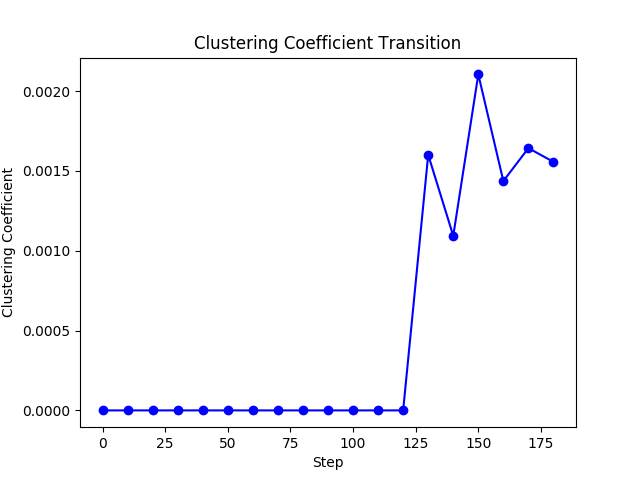
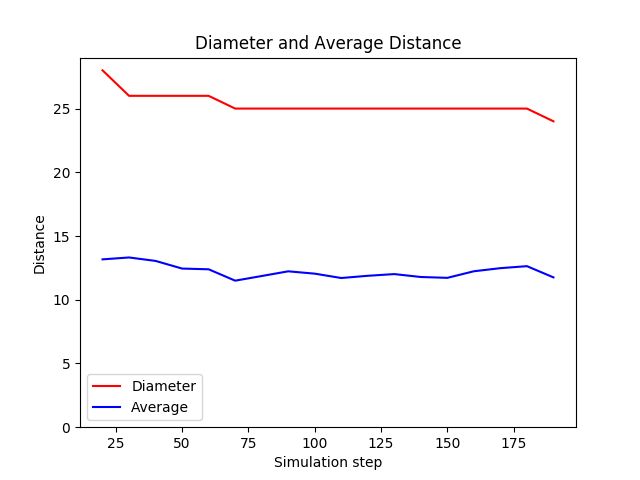
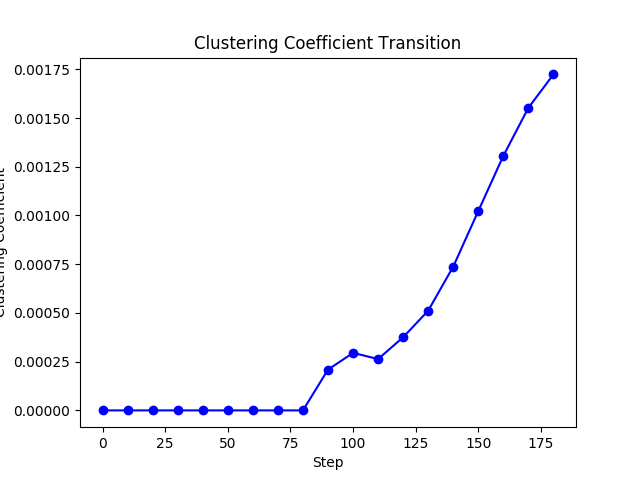
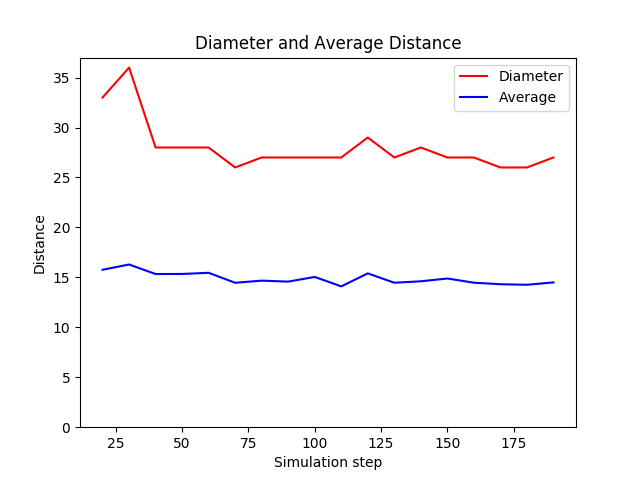
| Clustering Coefficient Transition | Diameter and Average Path Length | Number of Alert Patterns |
|---|---|---|
 |
 |
 |
| Number of Transactions for Each Step | Account Degree Distribution | WCC Size Distribution |
|---|---|---|
 |
 |
 |
| Clustering Coefficient Transition | Diameter and Average Path Length | Number of Alert Patterns |
|---|---|---|
 |
 |
 |
| Number of Transactions for Each Step | Account Degree Distribution | WCC Size Distribution |
|---|---|---|
 |
 |
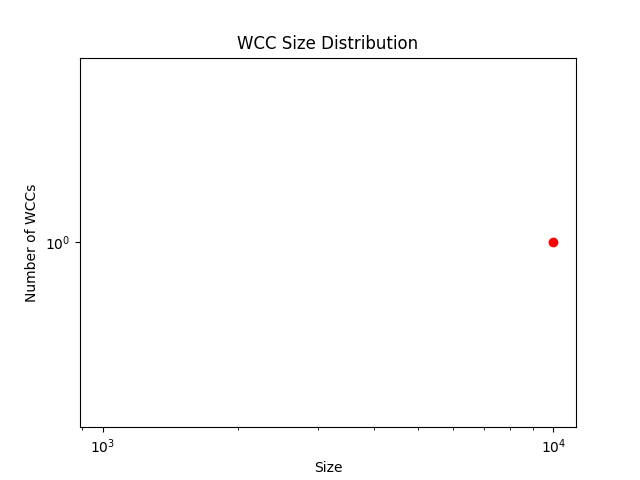 |
| Clustering Coefficient Transition | Diameter and Average Path Length | Number of Alert Patterns |
|---|---|---|
 |
 |
 |
| Number of Transactions for Each Step | Account Degree Distribution | WCC Size Distribution |
|---|---|---|
|
|
|
| Clustering Coefficient Transition | Diameter and Average Path Length | Number of Alert Patterns |
|---|---|---|
|
|
|
| Number of Transactions for Each Step | Account Degree Distribution | WCC Size Distribution |
|---|---|---|
 |
 |
 |
| Clustering Coefficient Transition | Diameter and Average Path Length | Number of Alert Patterns |
|---|---|---|
 |
 |
 |
- Hardware
- CPU: Intel(R) Xeon(R) CPU E5-2660 0 @ 2.20GHz, total 16 cores (8 cores, 2 sockets)
- RAM: 378GB DDR3 1333MHz
- Software
- OS: CentOS release 6.7 (Final)
- GCC: version 5.2.1 20150902 (Red Hat 5.2.1-2)
- Python: 2.7.12
- Java: 1.8.0_71 OpenJDK 64-Bit Server VM (build 25.71-b15, mixed mode)