
A Docker image for the pwmetrics CLI which should be used to test your application on behalf of performance guidelines from Google.
In case you want to integrate a performance test in your CI pipeline, we have an already pre configured Docker image at your hands. Execute the following commands in your pipeline to do so.
# First pull the required version of the docker image on your host, only needs to be done once.
# View the list of available tags at https://hub.docker.com/r/immowelt/pwmetrics/tags/
docker pull immowelt/pwmetrics:3.1.1

# Launch a test on http://domain-to-test.com/ with the config located at `$(pwd)/path/to/config/pwmetrics.config.js`.
# Note: The `$(pwd)` annotation is only supported in unix environments.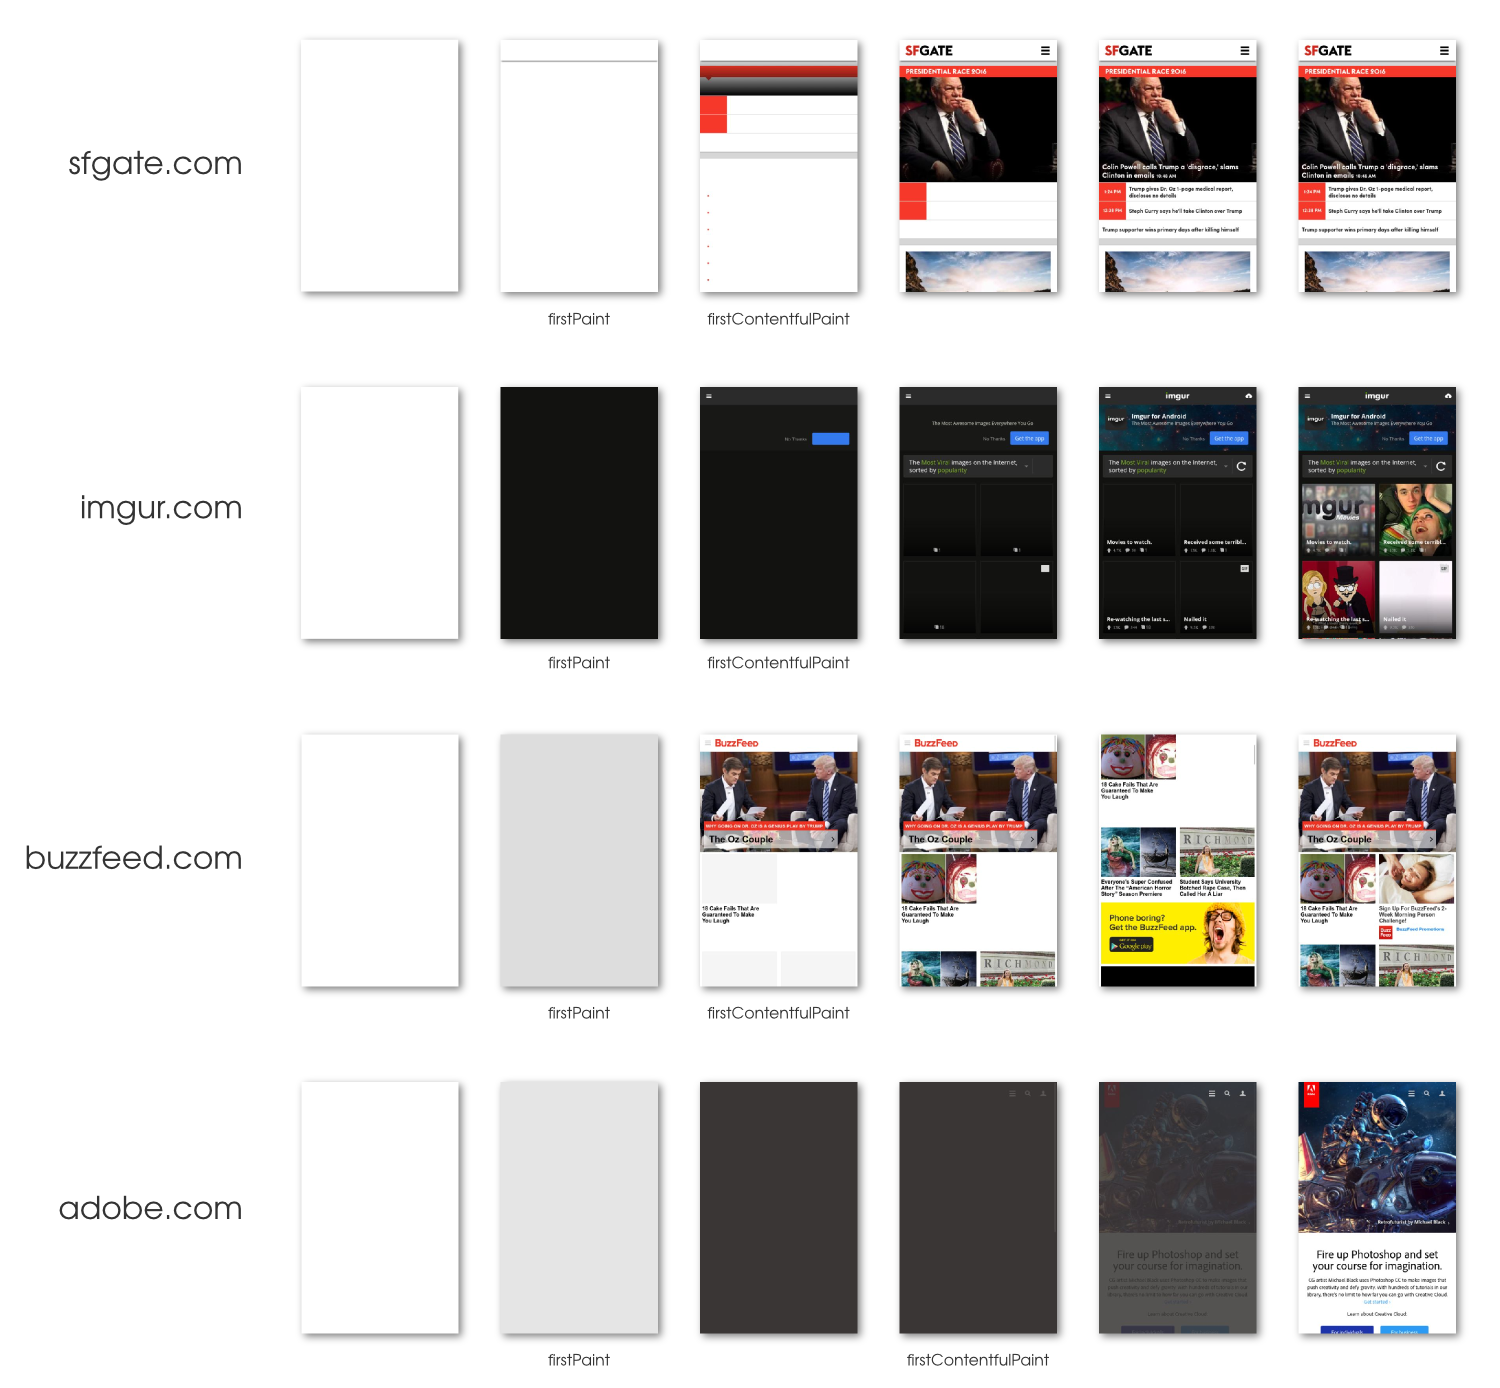
docker run -v $(pwd)/path/to/config/:/usr/pwmetrics-config immowelt/pwmetrics:3.1.1 http://domain-to-test.com/ --config=/usr/pwmetrics-config/pwmetrics.config.jsThe ttfmp, or commonly known as FMP, describes the time it takes until the browser paints the first frame of the application.
It was introduced since it signifies the user that the website / application is near to being loaded.
The ttfcp, or commonly known as FCP, describes the time it takes until the browser paints the first frame of text or content of the application.
It was introduced since it is the moment that the user starts scanning the page for content.
A visualized example of the two is shown below.
More information can be found here.
The psi is a threshold which was introduced as a rating for your website in regards to perceived performance.
This number scale is based on the principle „The-lower-the-better“, Google employee Paul Irish recommends a PSI of under 1000, but this is hard to achieve for bigger websites, the average score for the top 50 E-Commerce sites in the UK is between 3000 and 8500, so we set our maximum PSI as the median of this range of 5000.
https://developers.google.com/web/tools/lighthouse/audits/speed-index
See the LICENSE file at the root of the repository.