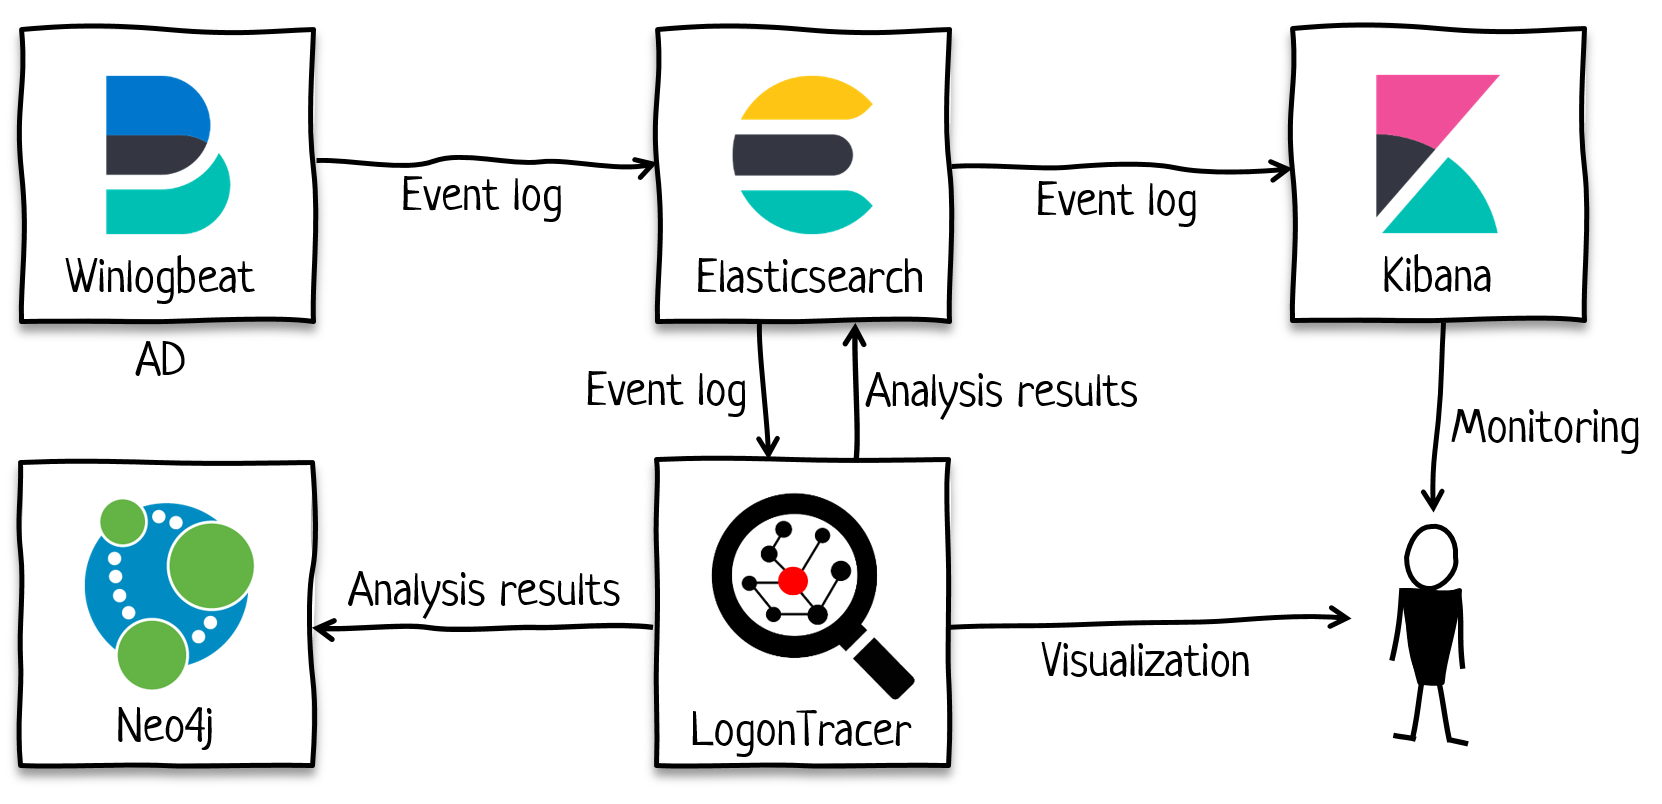
Combining LogonTracer with Elasticsearch
1. Link to Elasticsearch
2. Use of Docker Compose
3. Remarks
LogonTracer imports EVTX files and also event logs stored in Elasticsearch. LogonTracer’s event log analysis results can be saved on Elasticsearch. By default, LogonTracer imports AD event logs sent by Winlogbeat.
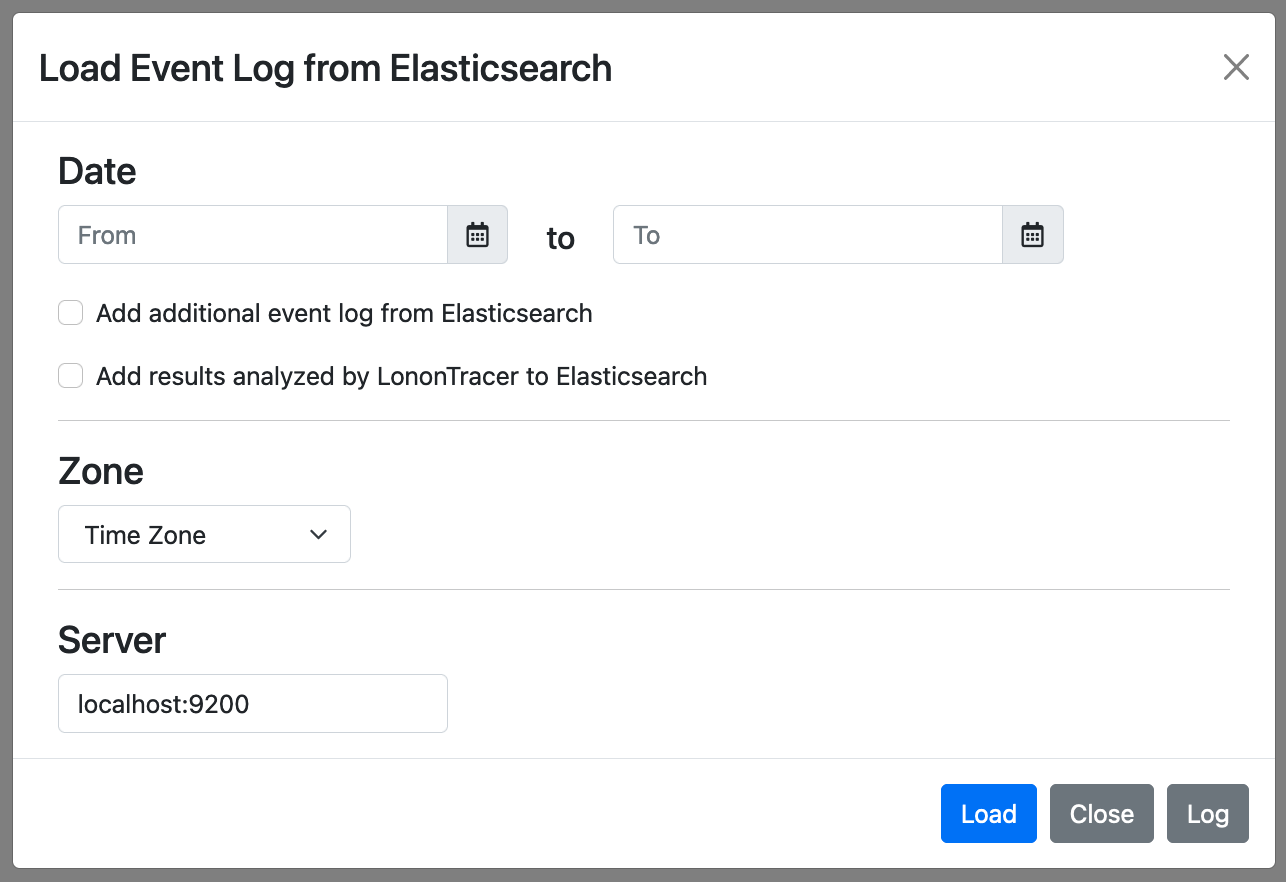
To import Elasticsearch logs into LogonTracer, choose "Load from ES" button. If you do not specify the time period of the logs to load, the entire logs will be imported. If the volume of the log is large, please make sure to specify the time period. To save the results of LogonTracer's event log analysis in Elasticsearch, enable "Add results analyzed by LogonTracer to Elasticsearch".
Detailed settings on Elasticsearch log import into LogonTracer can be configured on CUI.
To import Elasticsearch logs into LogonTracer by CUI, use the option "--es". To save the results of LogonTracer's event log analysis in Elasticsearch, use the option "--postes".
$ python3 logontracer.py --es --postes --es-server 192.168.1.1:9200There are other related options as below. Please use as necessary.
- --es-server: Elastic Search server address. (default: localhost:9200)
- --es-index: Elastic Search index to search. (default: winlogbeat-*)
- --es-prefix: Elastic Search event object prefix. (default: winlog)
- --es-user: Elastic Search ssl authentication user. (default: elastic)
- --es-pass: Elastic Search ssl authentication password.
- --es-cafile: Elastic Search ssl cert file.
- --es: Import data from Elastic Search. (default: False)
- --postes: Post data to Elastic Search. (default: False)
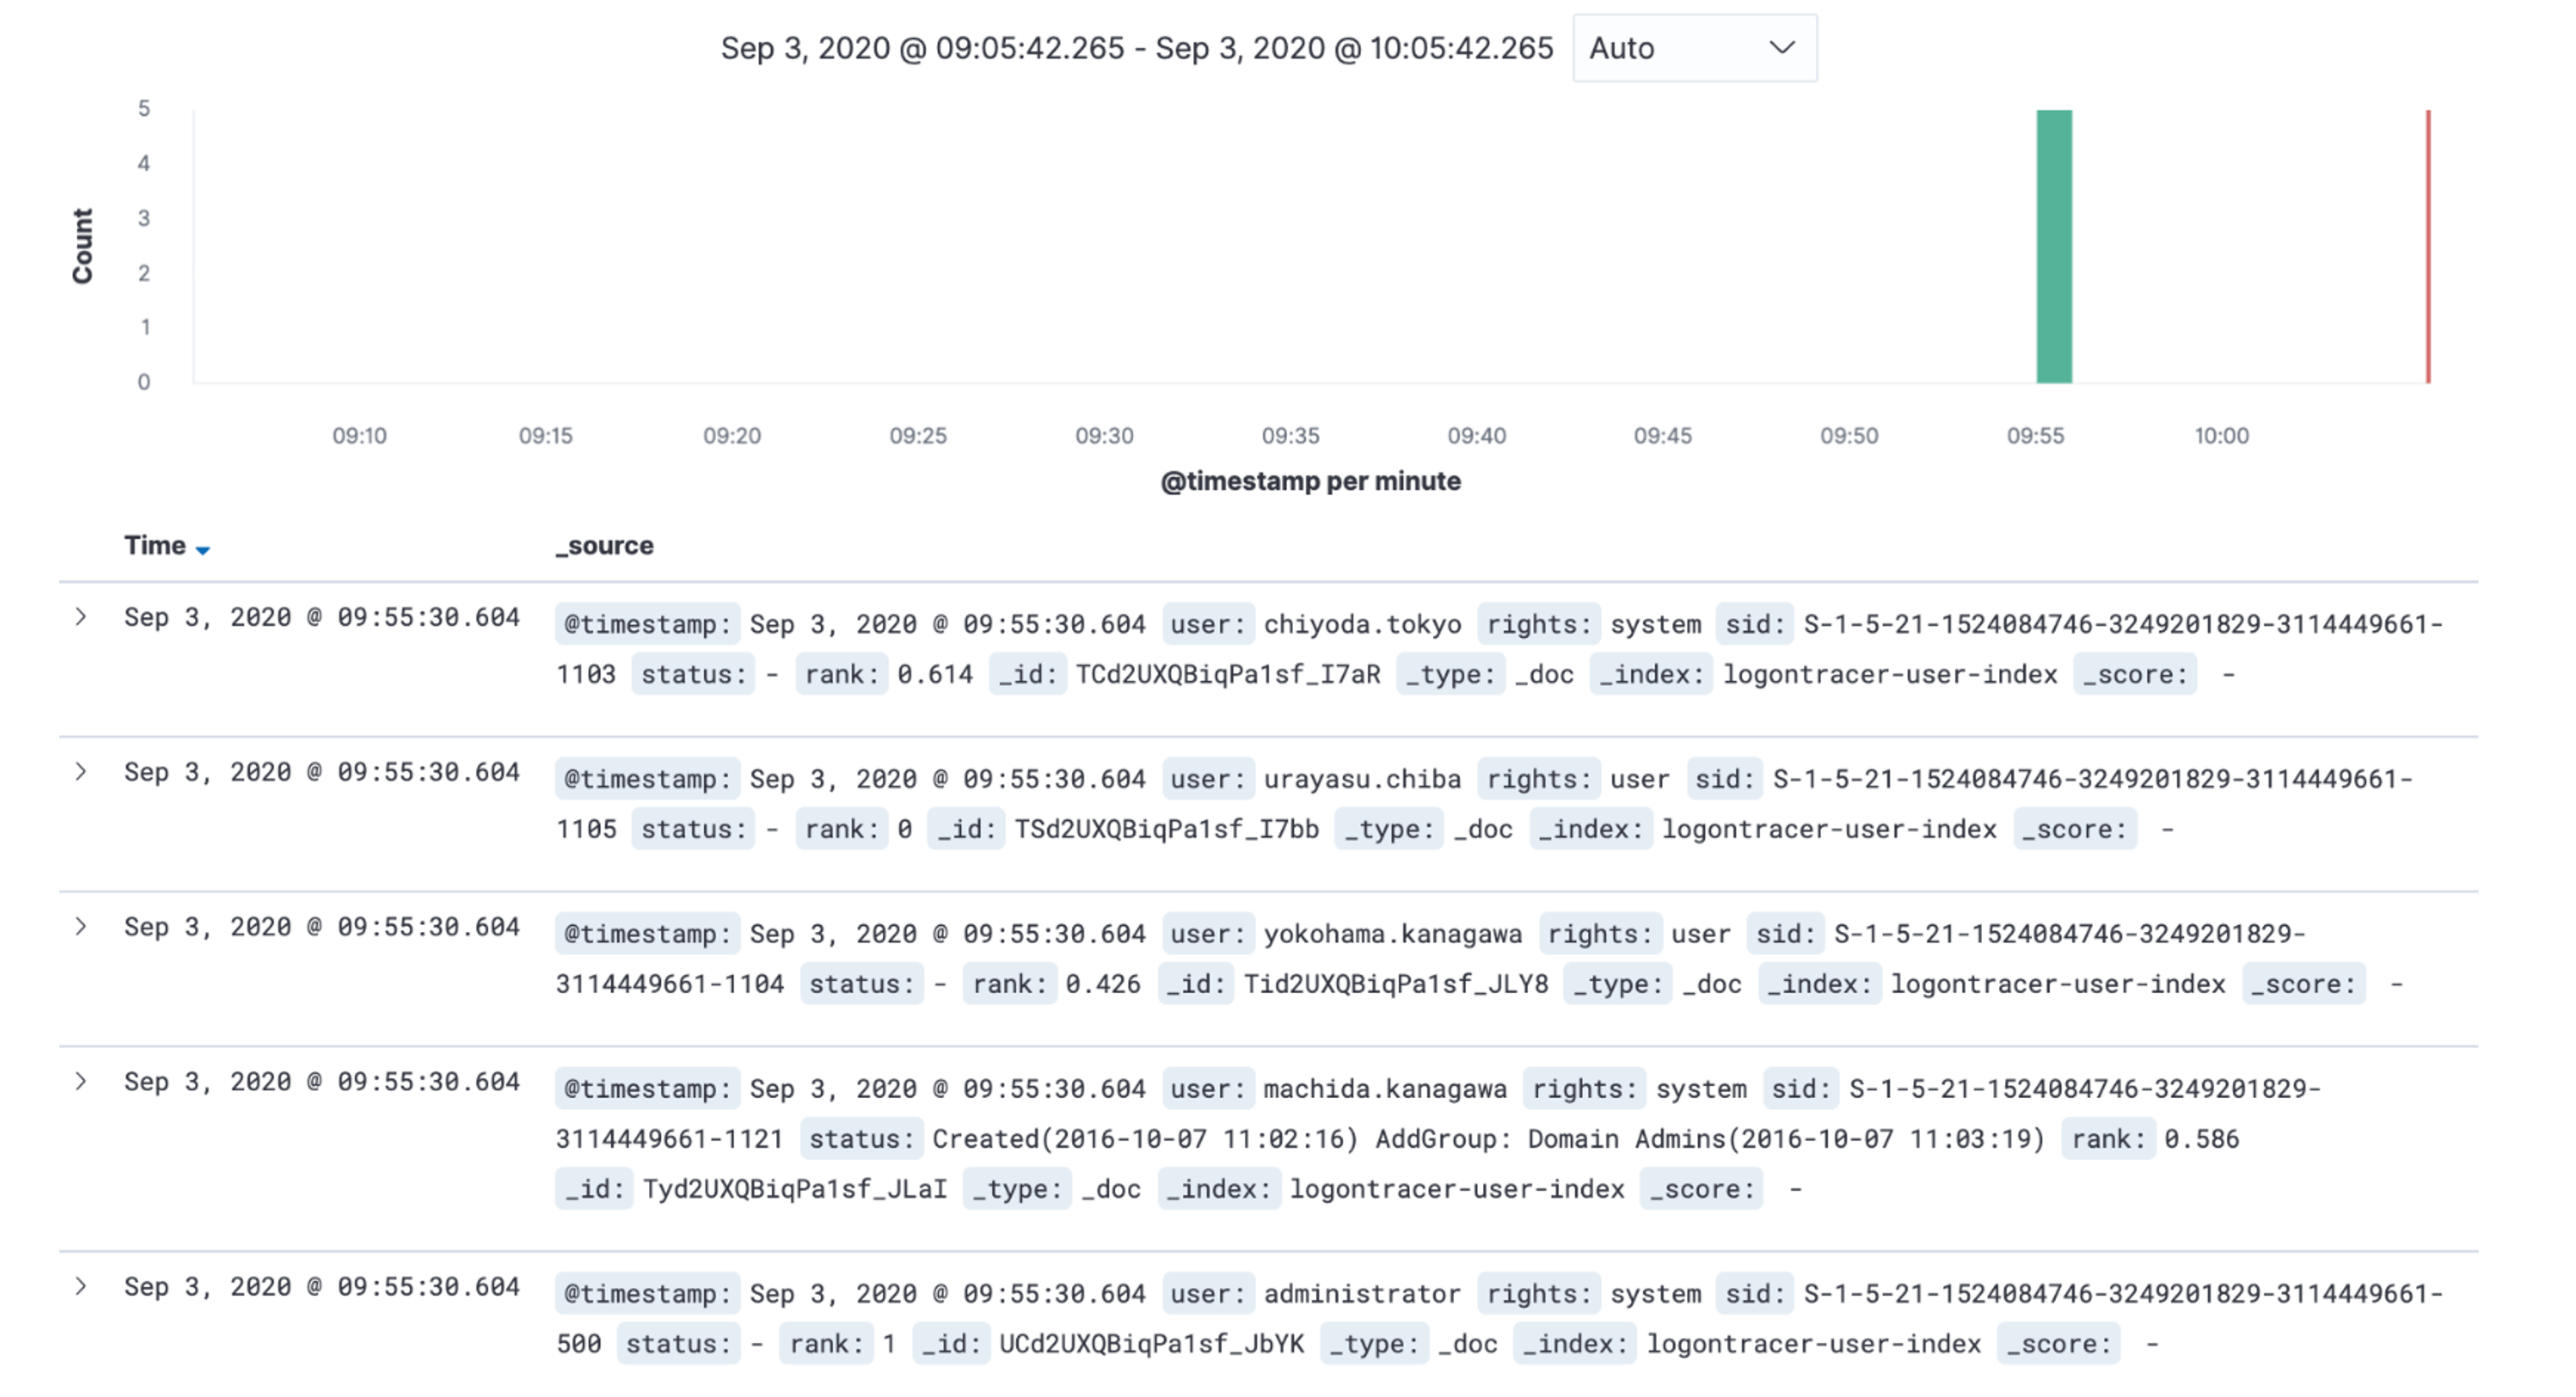
If you choose to save the results of LogonTracer's event log analysis in Elasticsearch by the option, you can check them on Kibana. The analysis result on LogonTracer is saved under the index name "logontracer-user-index" and "logontracer-host-index".
To search the results of LogonTracer's event log analysis directly on Elasticsearch, use the below query.
$ curl -H "Content-Type: application/json" -XPOST 'localhost:9200/logontracer-user-index/_search?pretty' -d '
{
  "query": {
    "match_all": {}
  },
  "size": 10,
  "sort": {
    "rank": {
      "order": "desc"
    }
  }
}'$ curl -H "Content-Type: application/json" -XPOST 'localhost:9200/logontracer-user-index/_search?pretty' -d '
{
"query": {
"match": {
"status": "2020 "
}
}
}'$ curl -H "Content-Type: application/json" -XPOST 'localhost:9200/logontracer-user-index/_search?pretty' -d '
{
"query": {
"match": {
"rights": "system"
}
}
}'For the purpose of testing LogonTracer’s link to Elasticsearch, docker-compose.yml is available, which simultaneously runs LogonTracer, Elasticsearch and Kibana. For actual use, please consider clustering the containers and tuning the performance as necessary depending on the volume of the logs.
$ git clone https://github.com/JPCERTCC/LogonTracer.git
$ cd LogonTracer\docker-compose-with-elastic-stackChange the contents of docker-compose.yml as necessary.
If not a localhost, change it to an IP address.
environment:
  - LTHOSTNAME=localhost
$ docker network create neo4j-network$ docker compose build
$ docker compose up -dWe do not recommend importing long-term logs (such as a month or a year) in order to maintain the speed of LogonTracer's visualisation function. It is recommended to import logs at intervals of a week or even a day for more effective analysis. (Appropriate log duration varies depending on the number of hosts and users.)
In order to use LogonTracer for AD event log monitoring purposes, import and analyze event logs periodically by using cron etc., delete old logs in the database with the "--delete" option and store the results in Elasticsearch with the "--postes" option. This enables monitoring suspicious logs and account ranking on Kibana. If any suspicious logs are found, you can conduct further investigation efficiently on LogonTracer by importing logs retained during the specific period and perform visualization.