-
Notifications
You must be signed in to change notification settings - Fork 409
New issue
Have a question about this project? Sign up for a free GitHub account to open an issue and contact its maintainers and the community.
By clicking “Sign up for GitHub”, you agree to our terms of service and privacy statement. We’ll occasionally send you account related emails.
Already on GitHub? Sign in to your account
Customising each bar drawn within a chart #189
Comments
|
I don't think we support rounded corners on bar-charts at the moment. We draw the bars as "shapes" instead of rectangles and as such the don't support any radius props. The gradients is supported, have a look at this example |
|
Thanks @JesperLekland, appreciate the details regarding per-bar drawing options (specifically rounding). Regarding the gradients, do you have an example of the gradient being applied relative to the bar's size within the overall graph "spectrum"? Or will I need to create a proportional gradient start and finish per bar, based on the overall chart gradient? |
|
@markedup Unfortunately don't have an example. I think you'll need to create one gradient per bar and do some calculations based on it's relation to the entire data set min/max. Perhaps some color interpolation |
|
No worries, @JesperLekland – thanks again for your help. I was thinking it would need to be an interpolated, per-bar gradient; if I produce anything useful, I'll share it here. |
|
Great, thanks for the input. I'll keep this issue open to remind me about the borderRadius for BarChart |
|
HI @markedup , were you able to solve this? I'm trying to do something similar, but I don't know how to make the color fill only a certain height of the bar @JesperLekland Please I'd appreciate your thoughts on this too |
|
@markedup Hi, pls help i dont know how to border this bar. |

What is the problem?
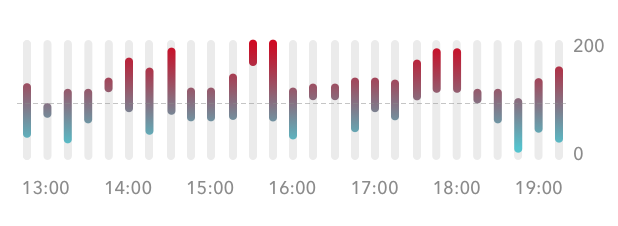
I'd like to visually round off the ends of a

StackedBarChartelement’s bars – both foreground data and background guides – like so:I'd also like to apply a gradient effect to each bar, as per the illustration above.
However, having read through the documentation and looked at the examples, I haven't discovered if customisation for individual bar chart elements is possible in this specific way.
Can someone tell me how to apply these customisations to each bar please?
The text was updated successfully, but these errors were encountered: