0x02a DebugMonitor_zh
如果你想要在生产环境使用AndroidGodEye
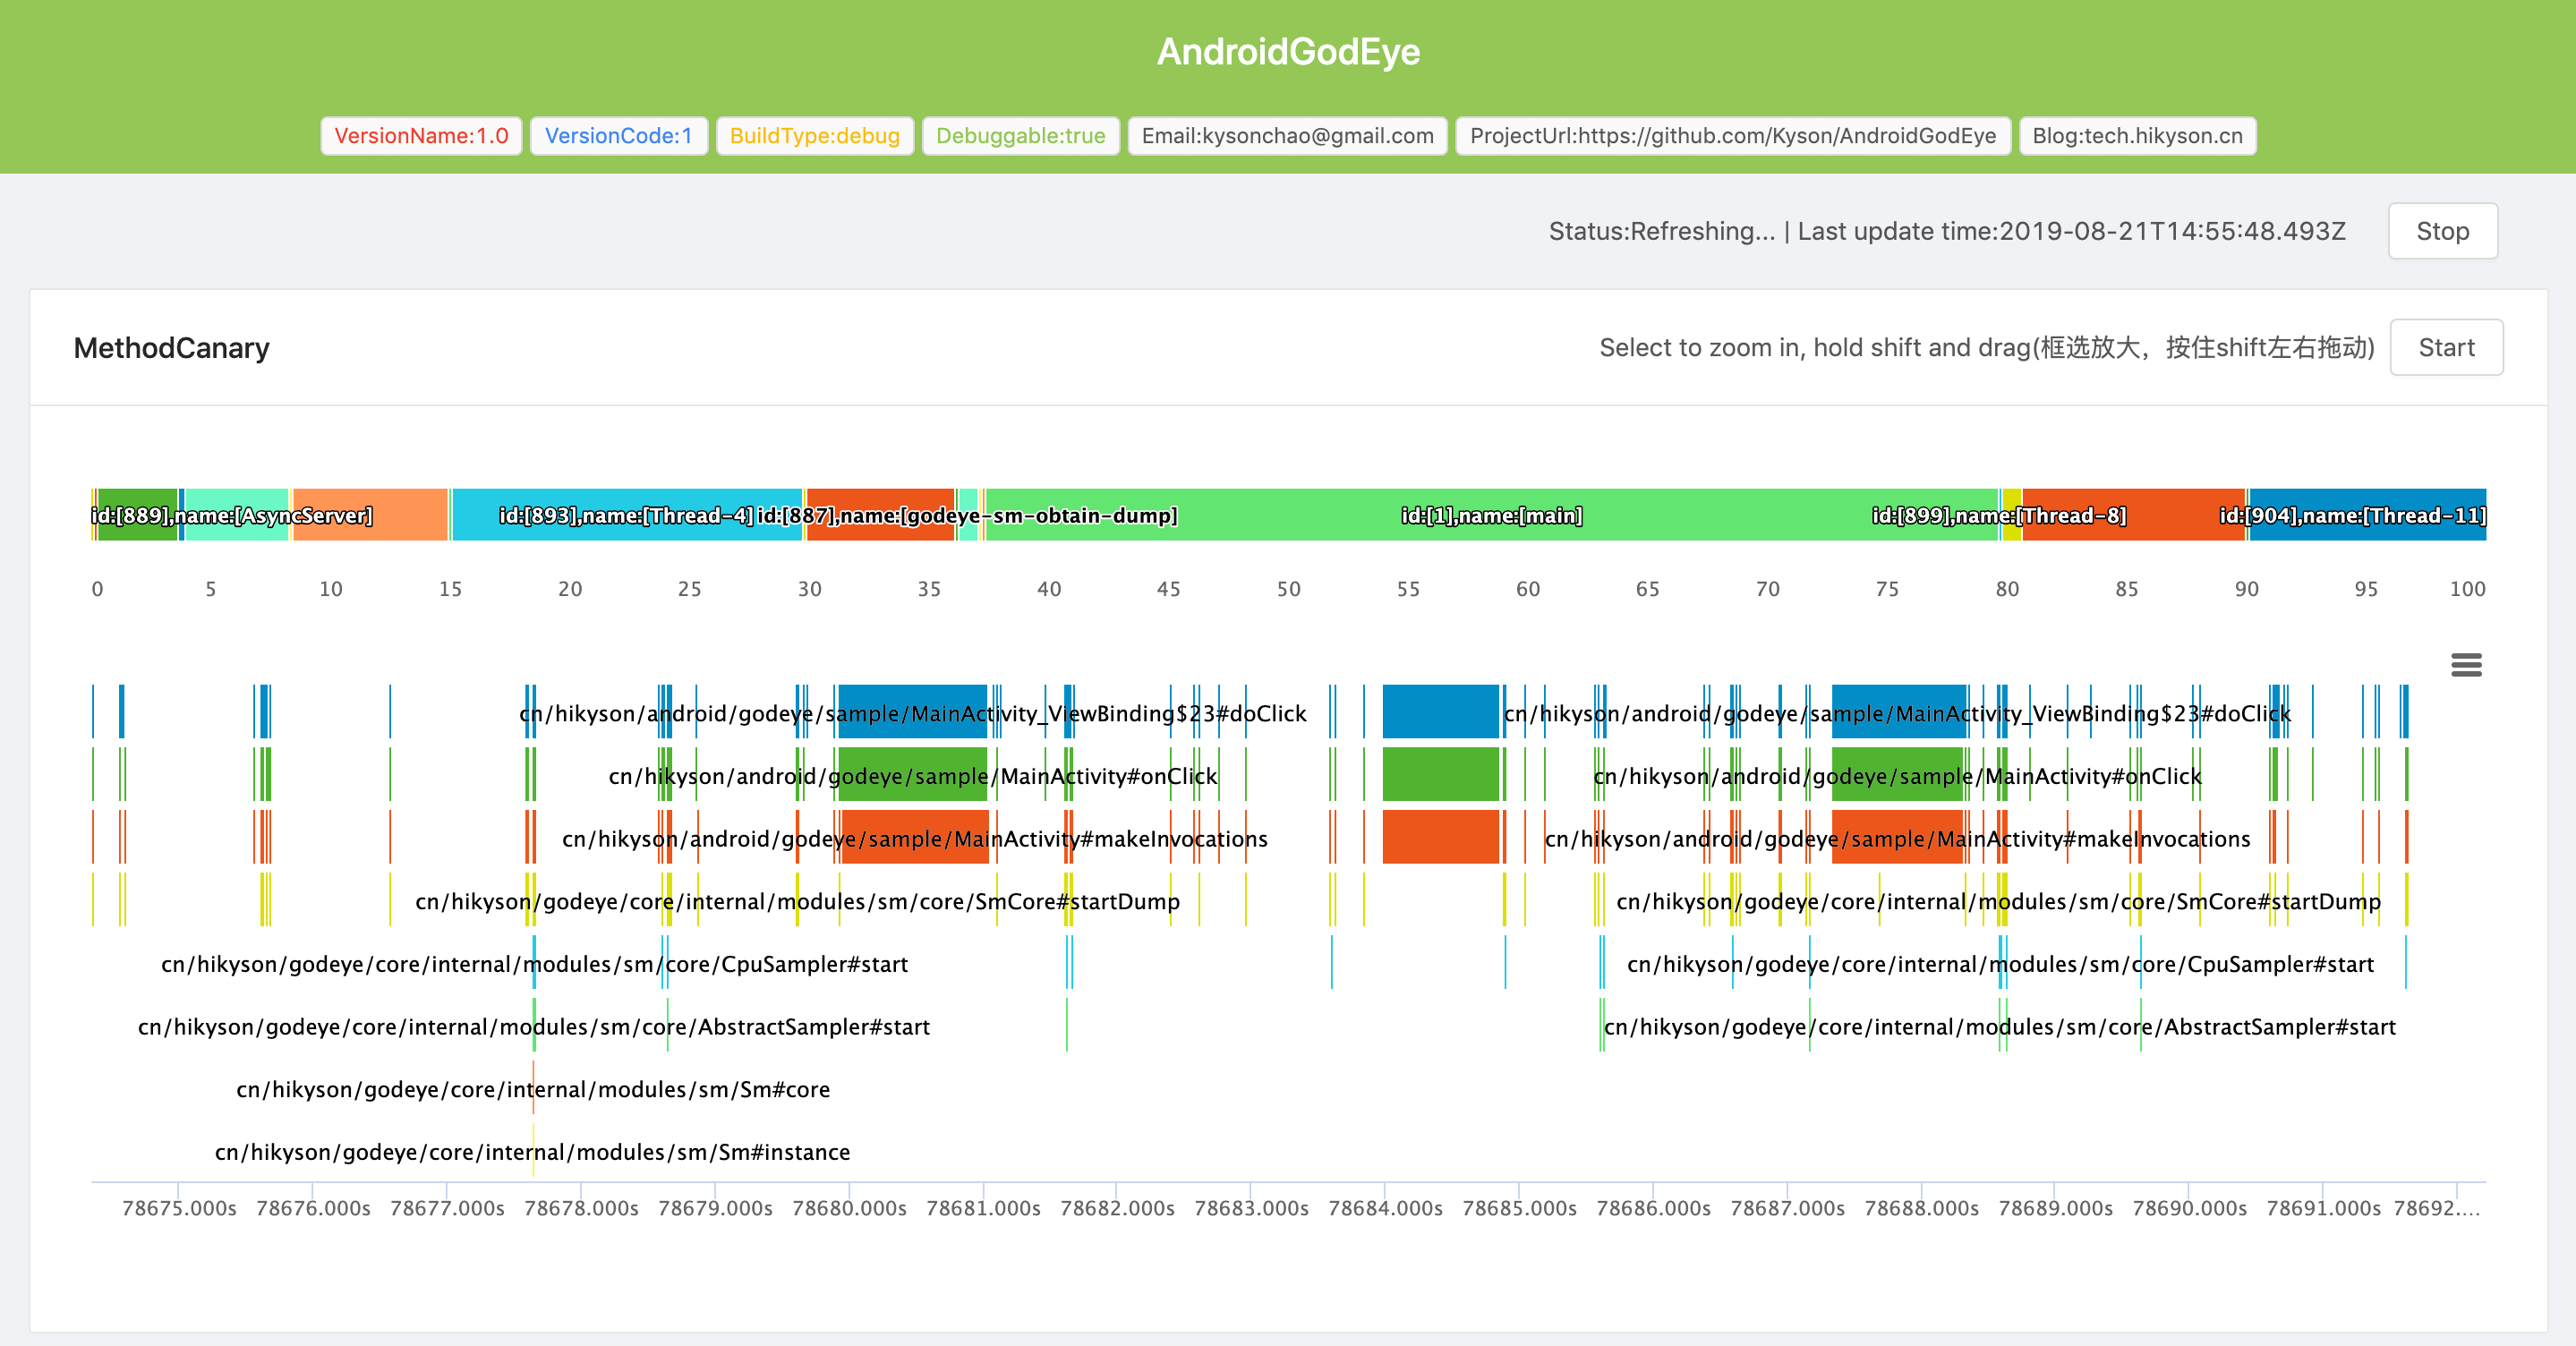
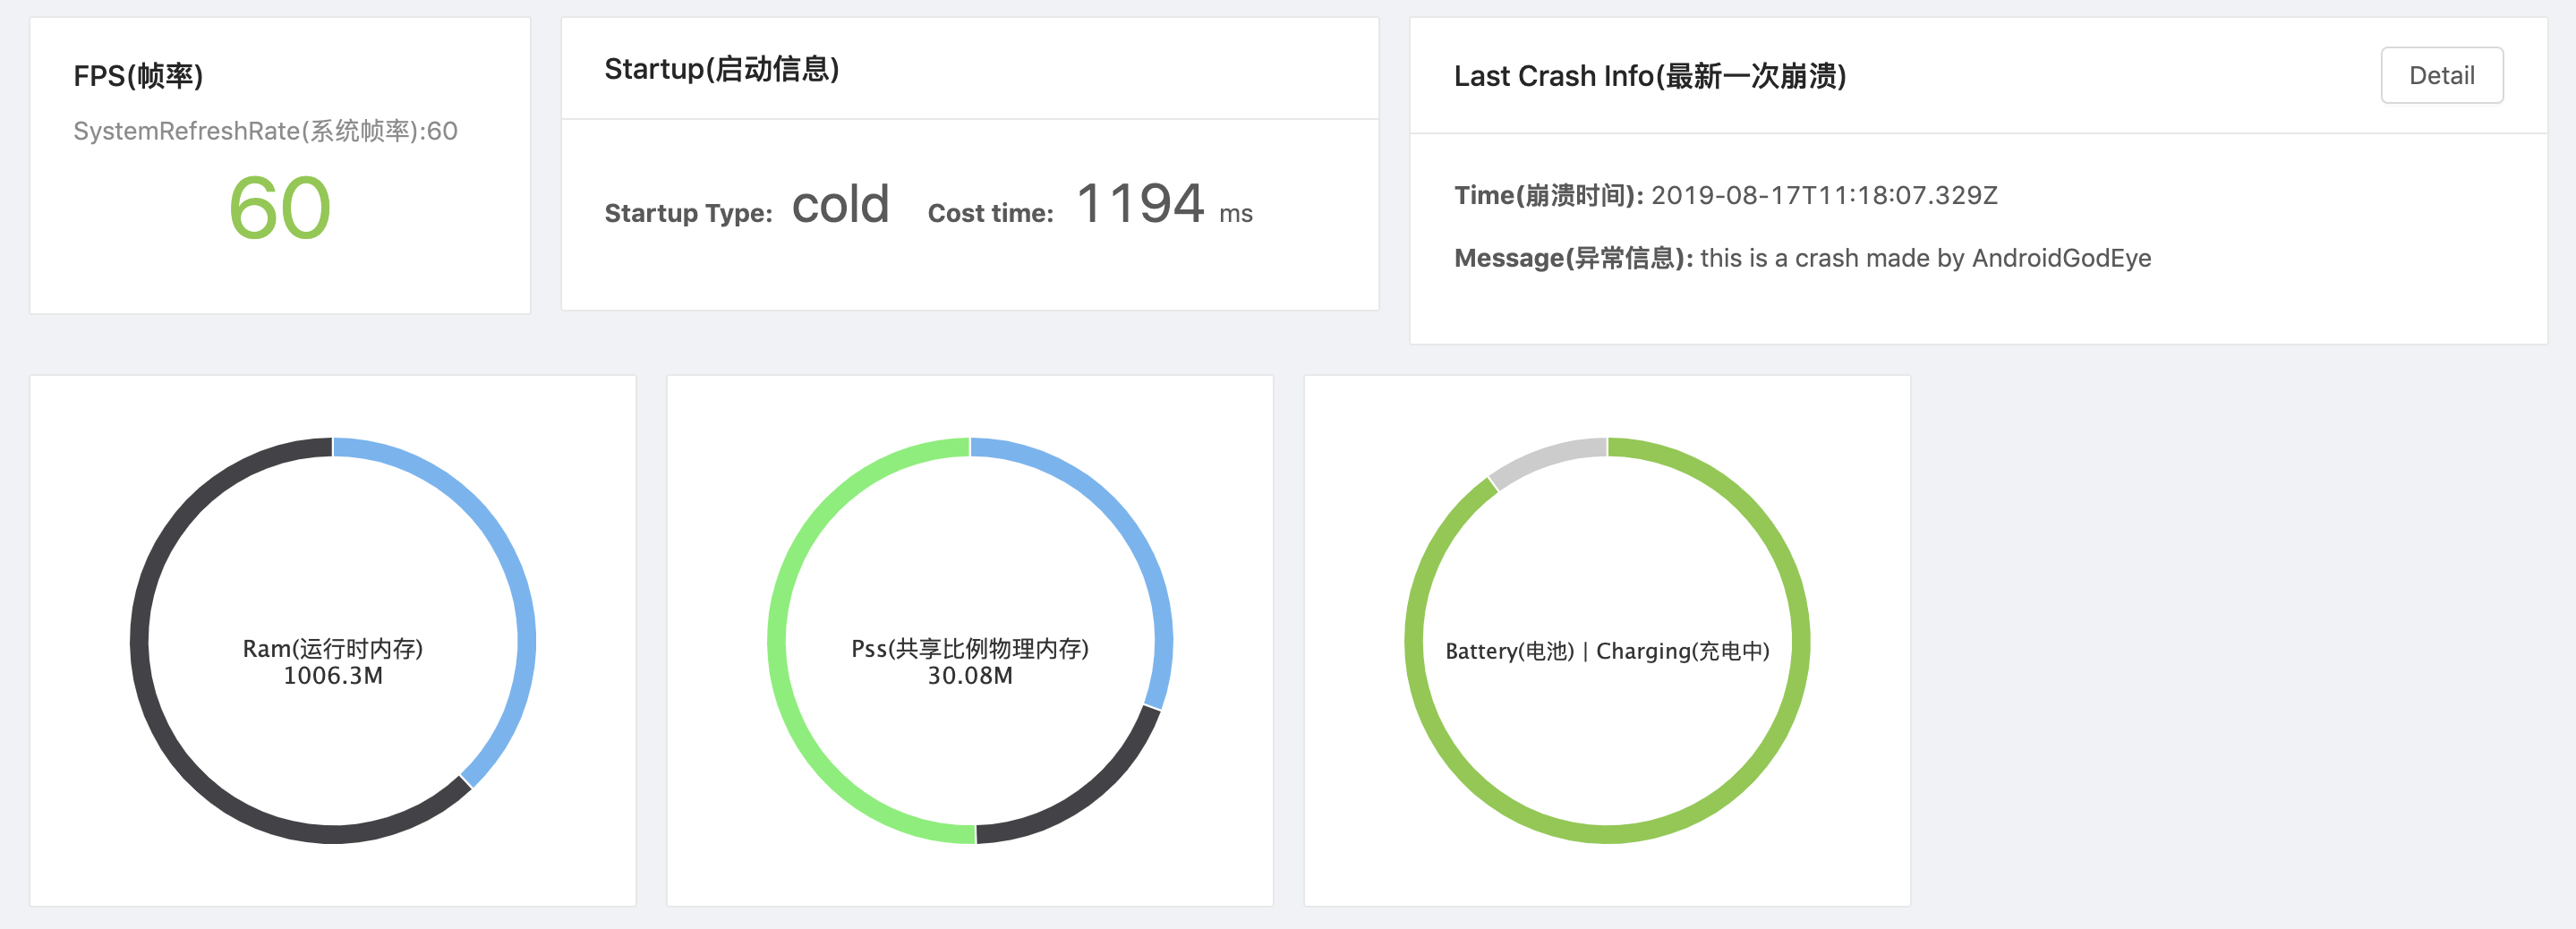
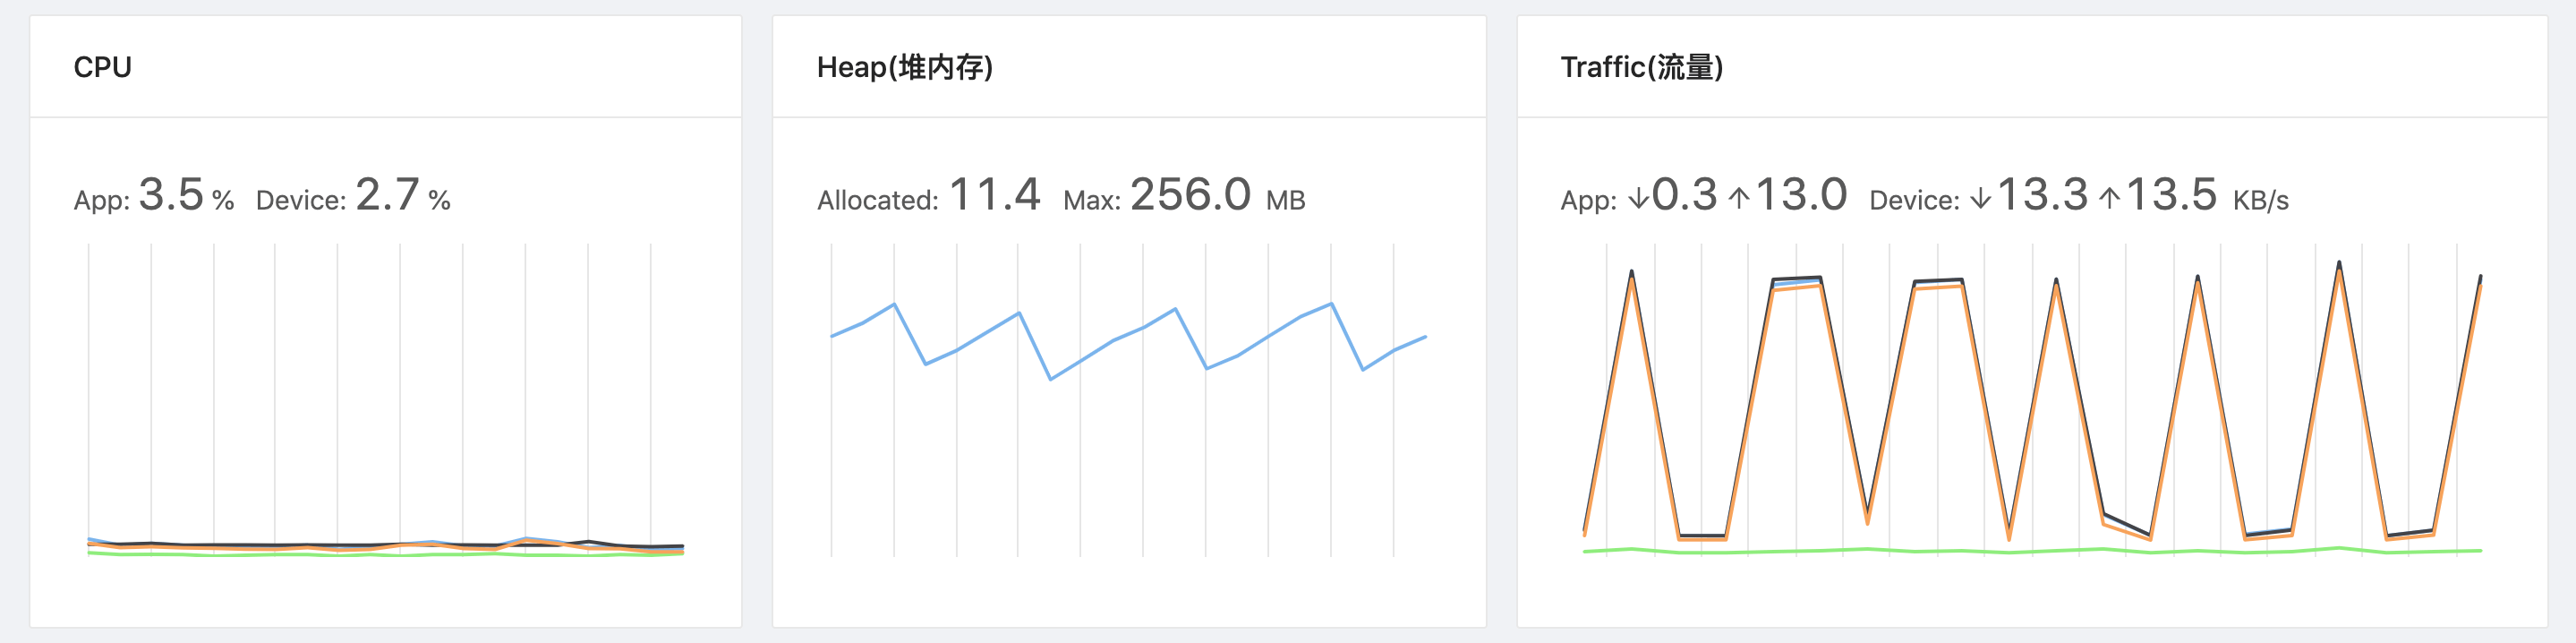
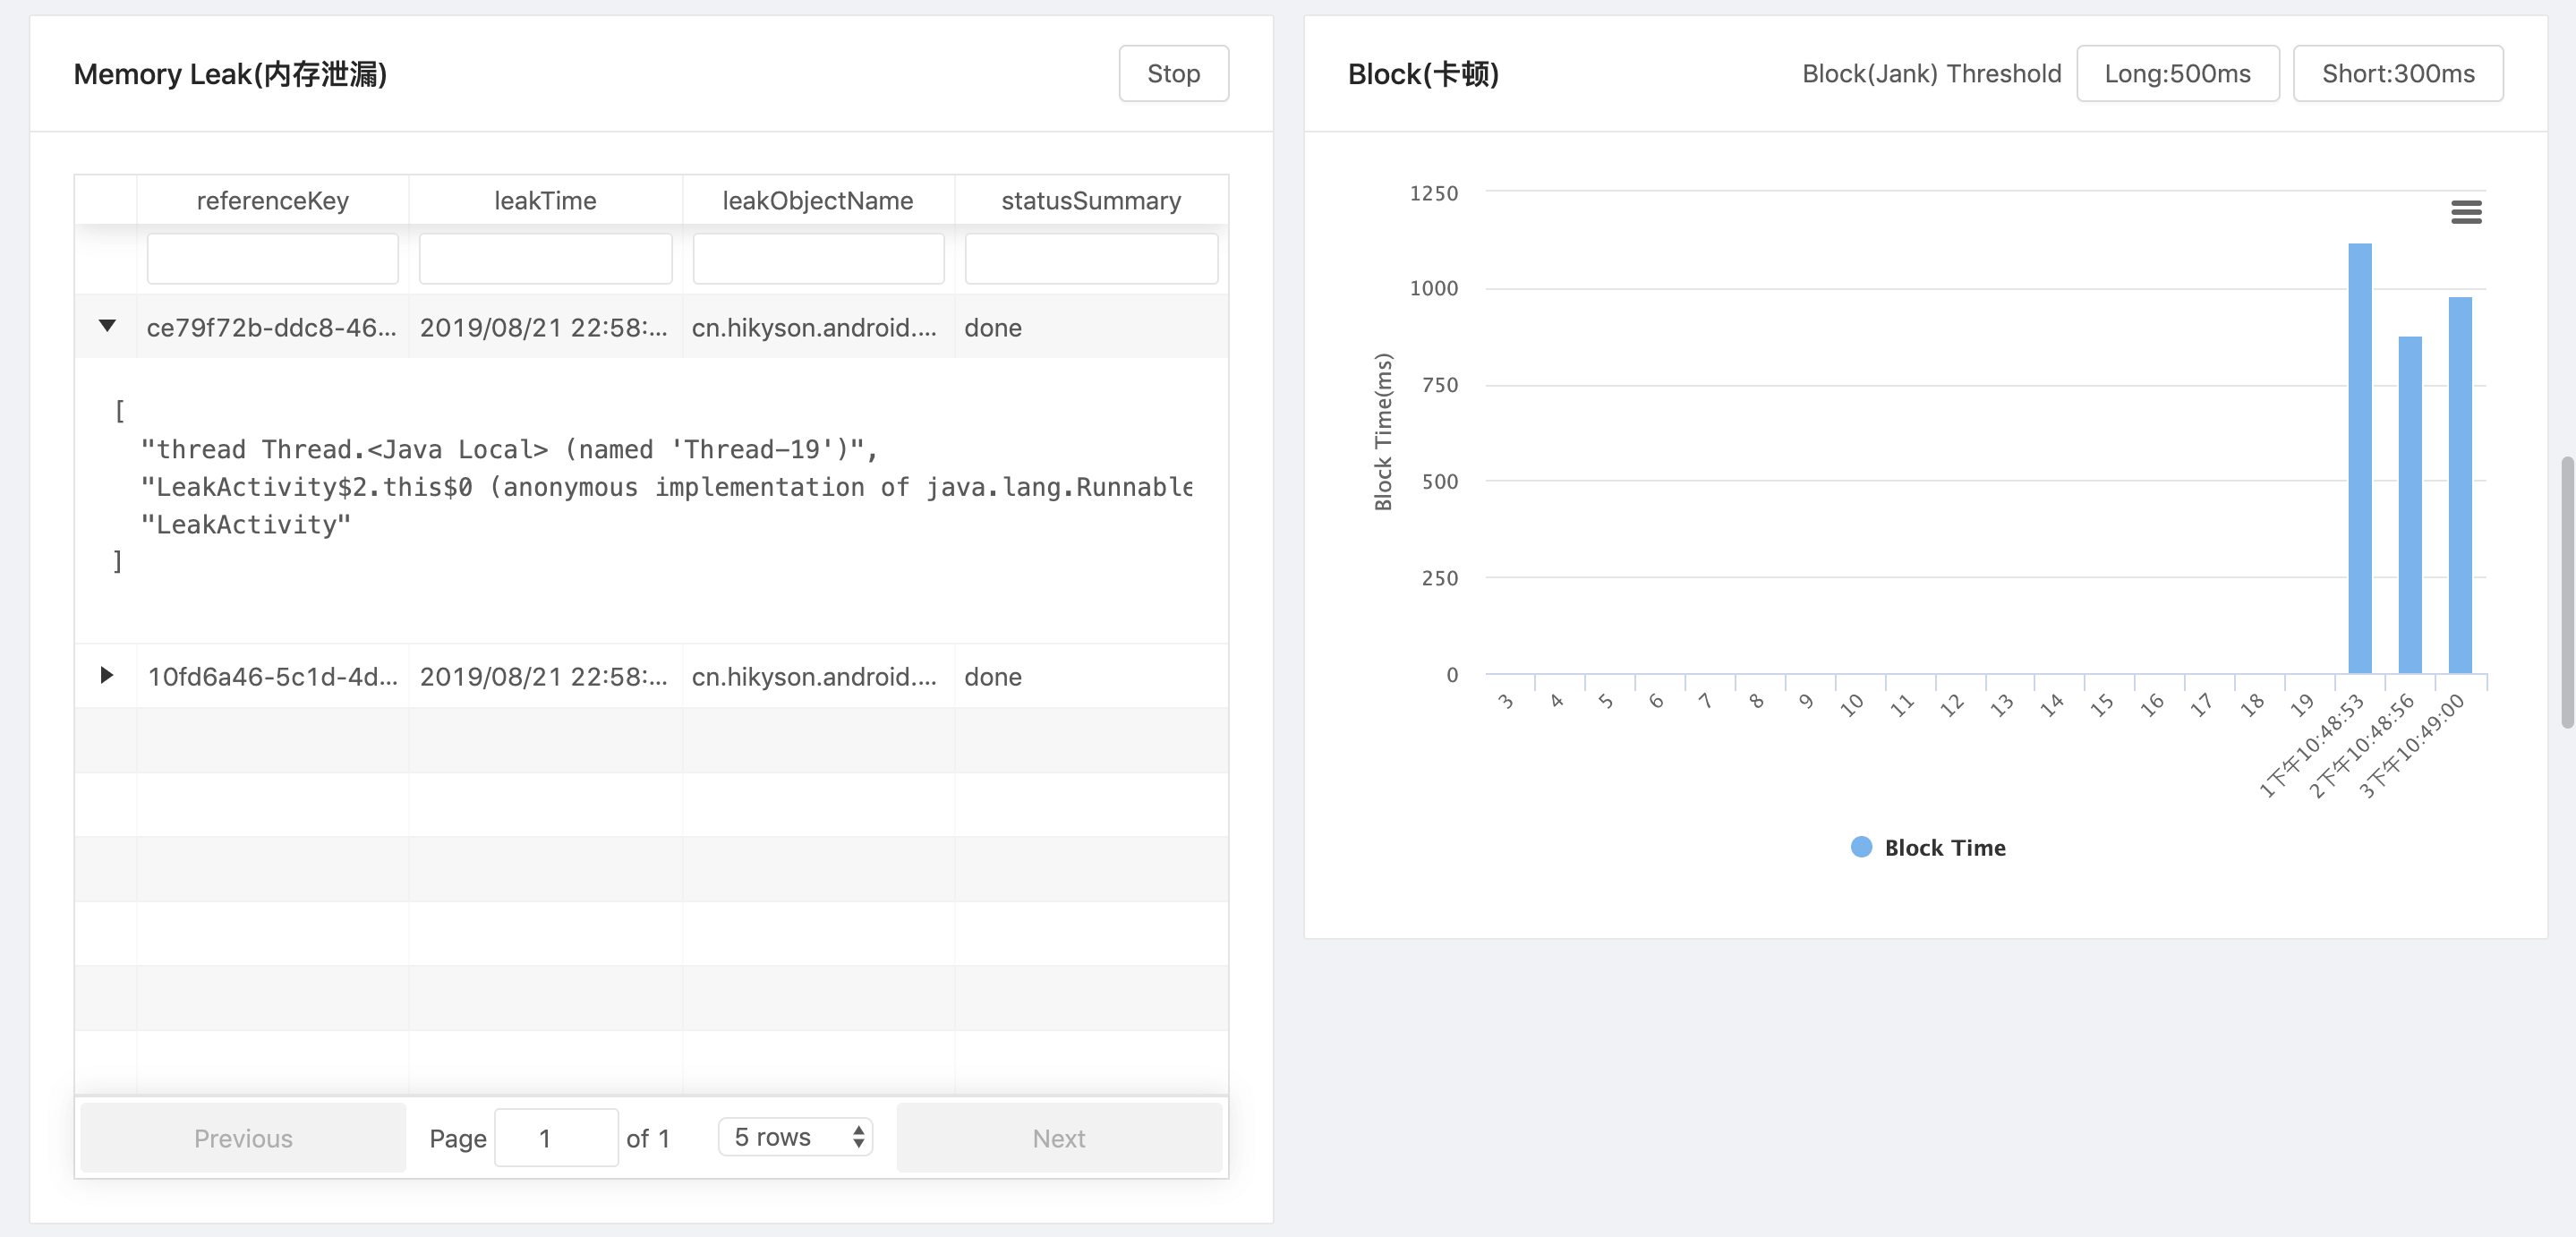
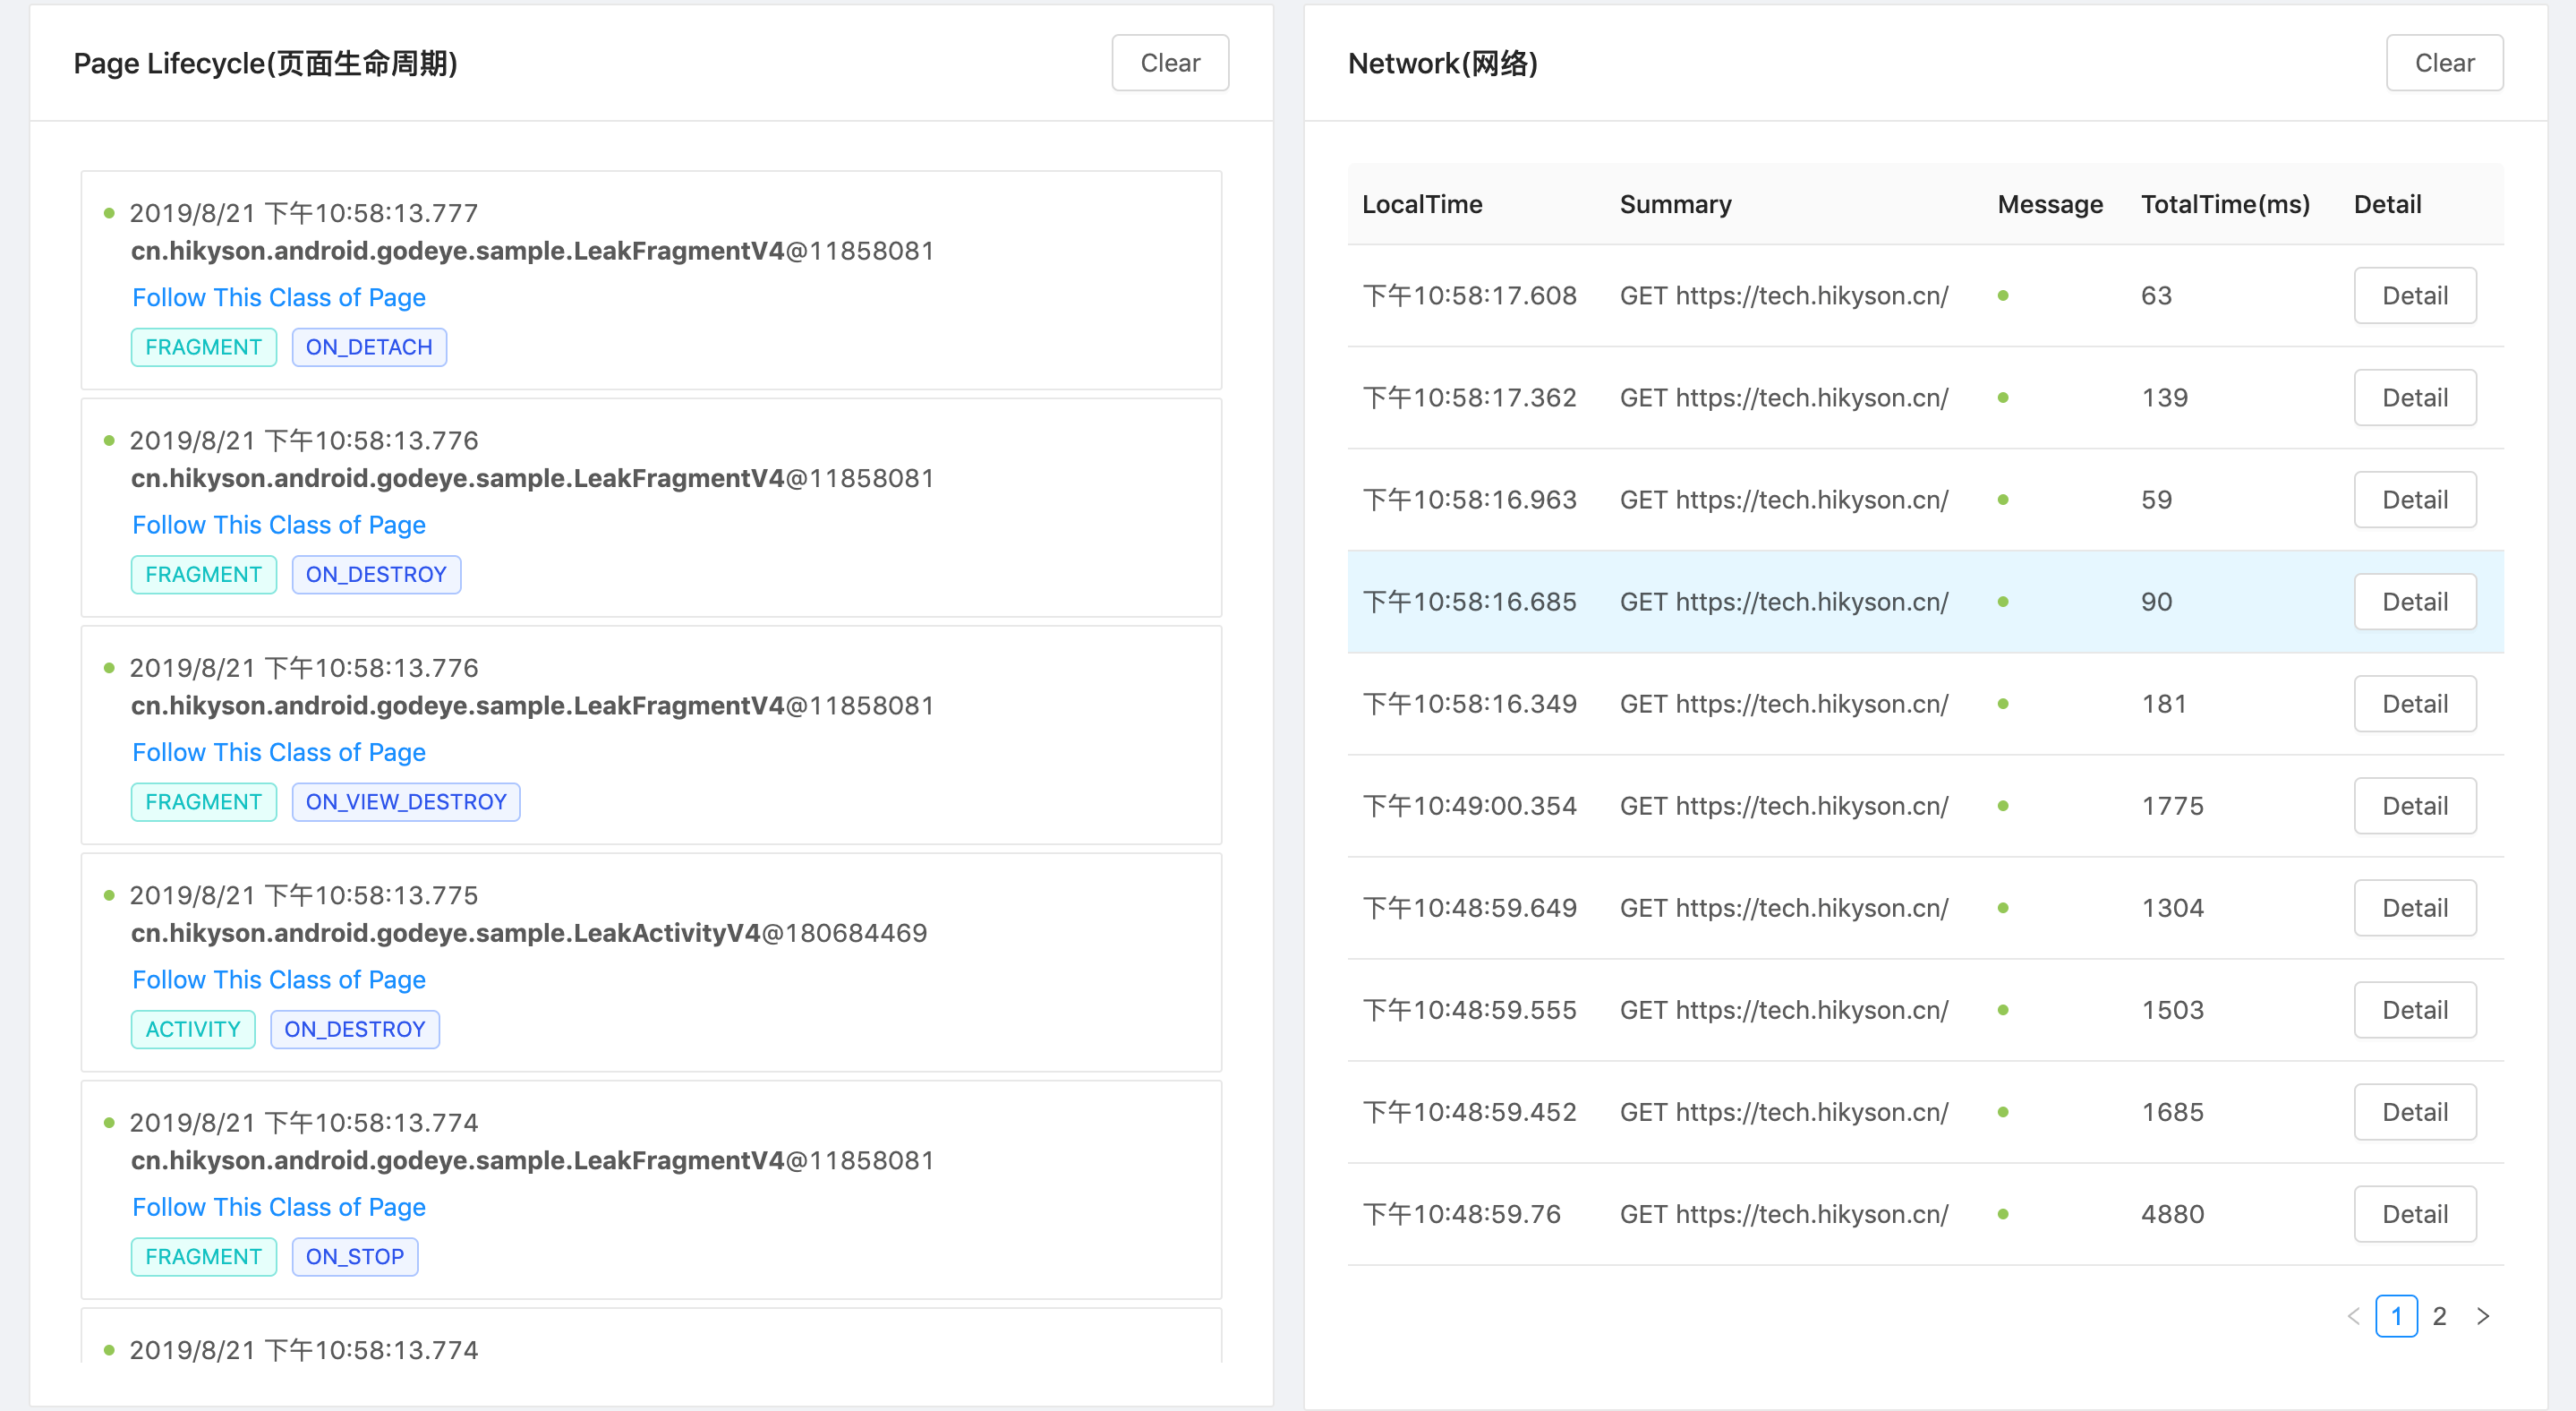
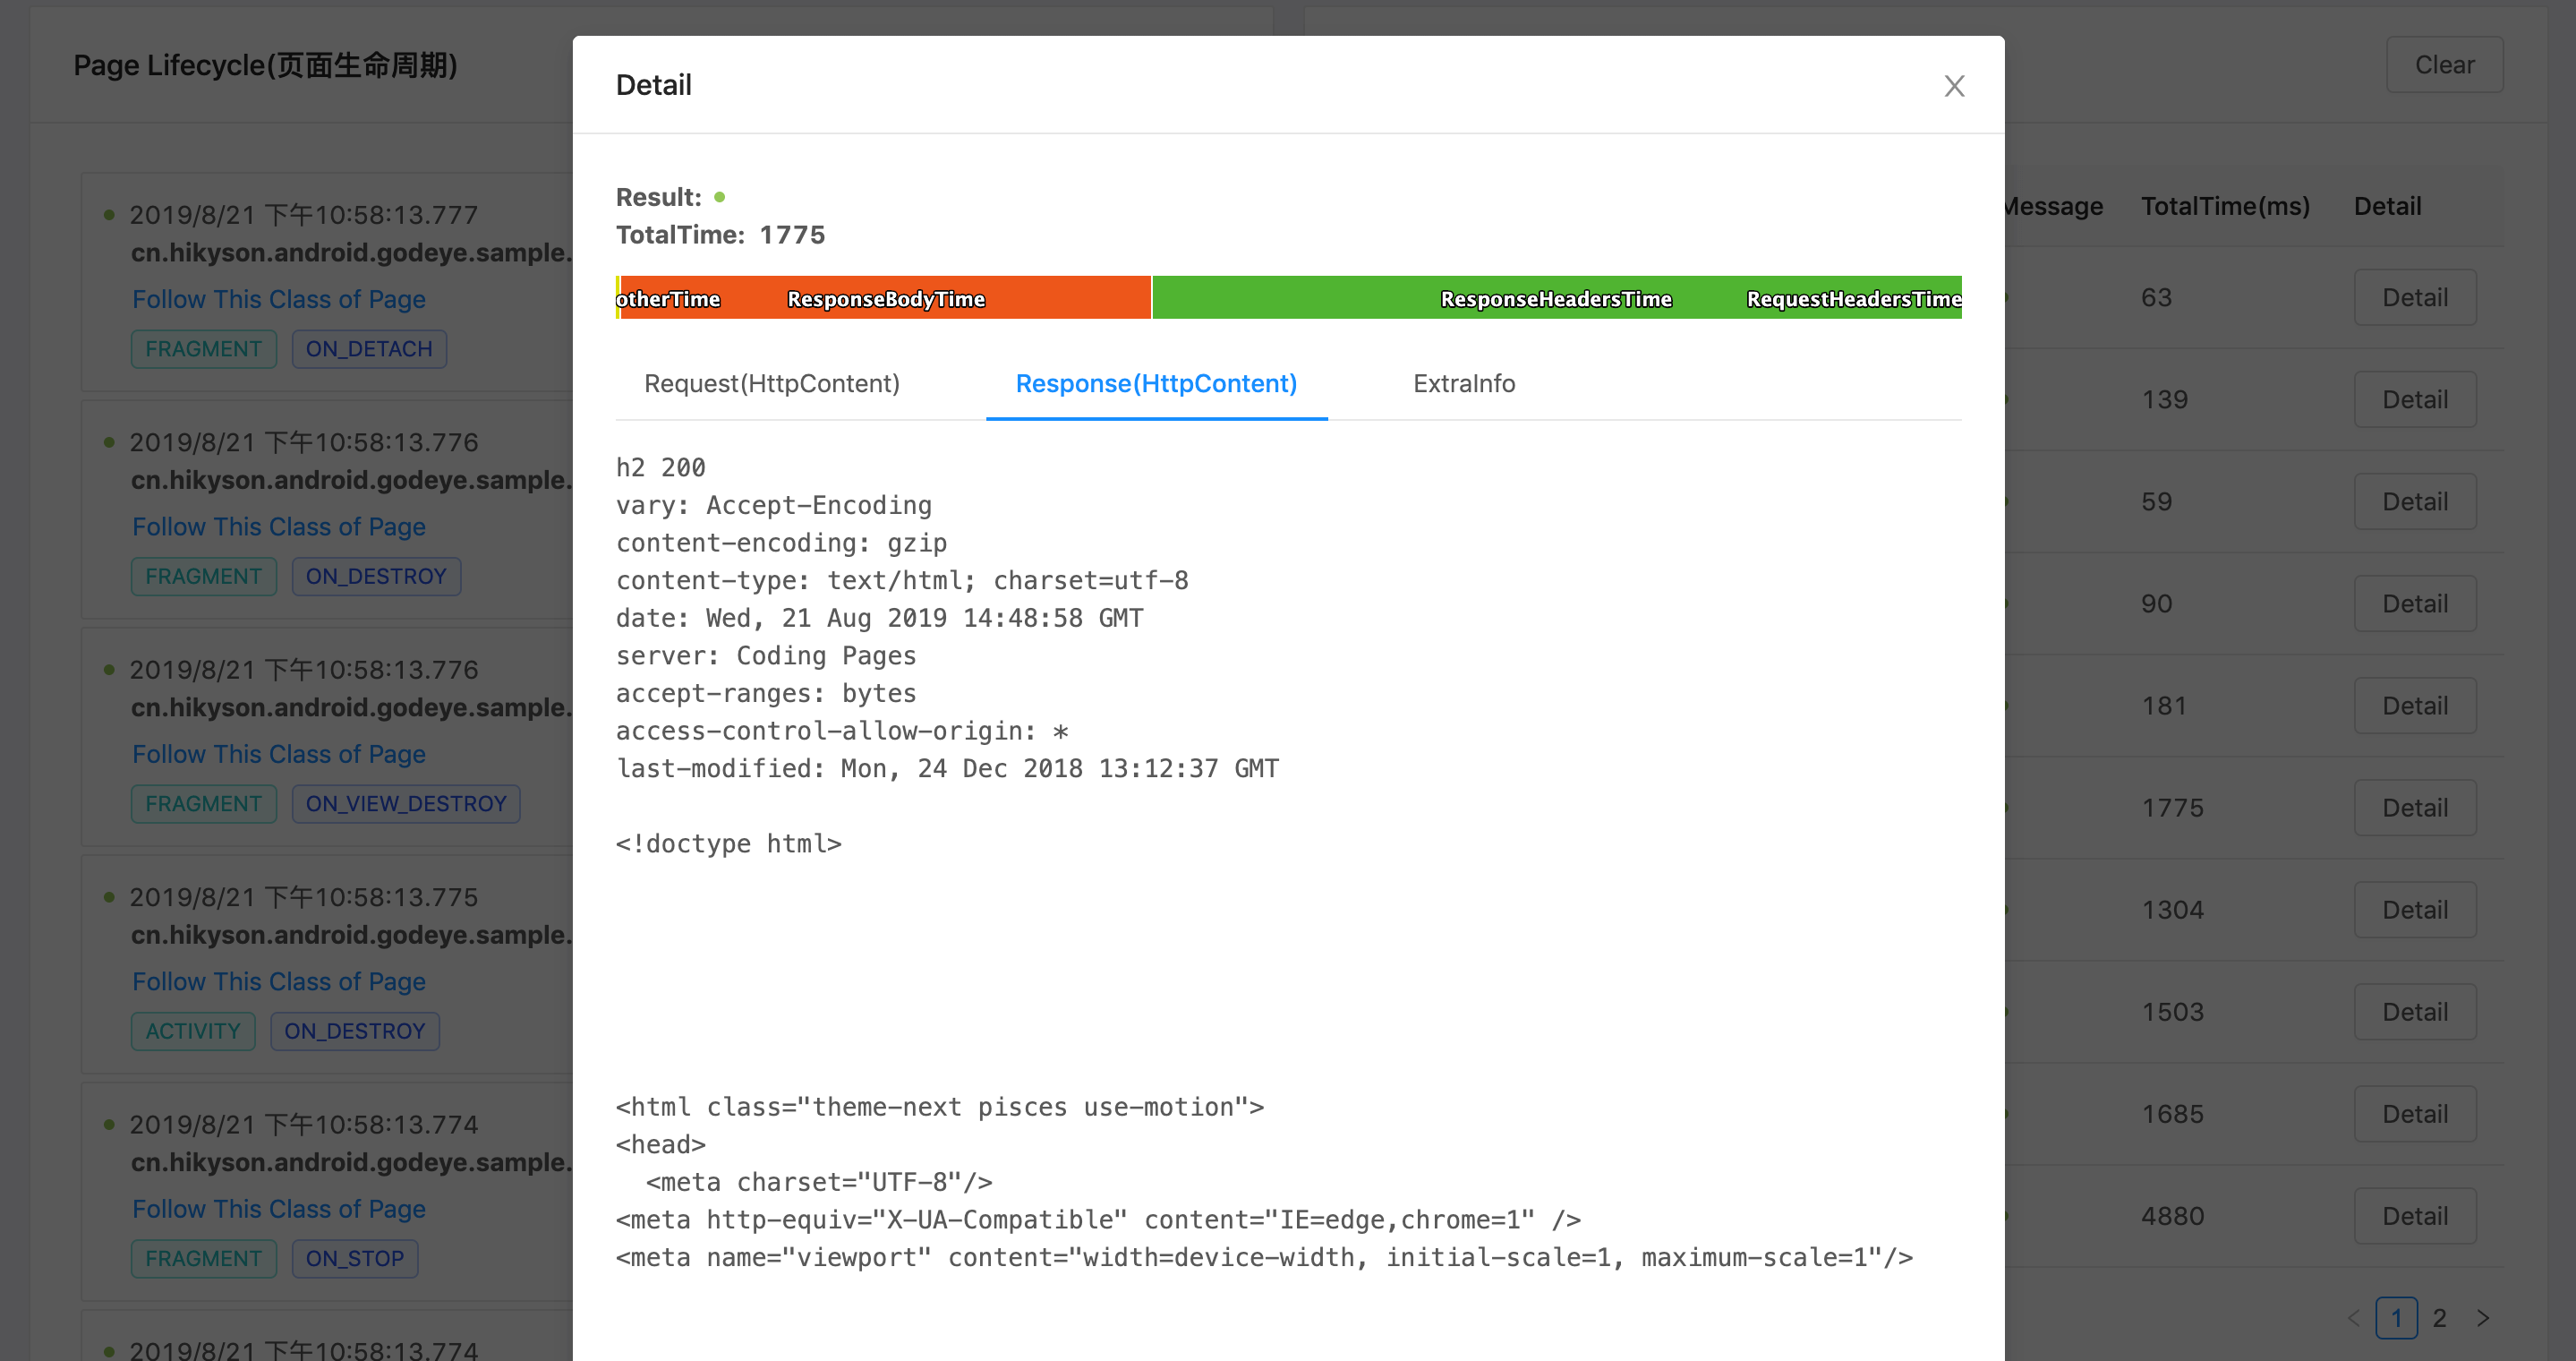
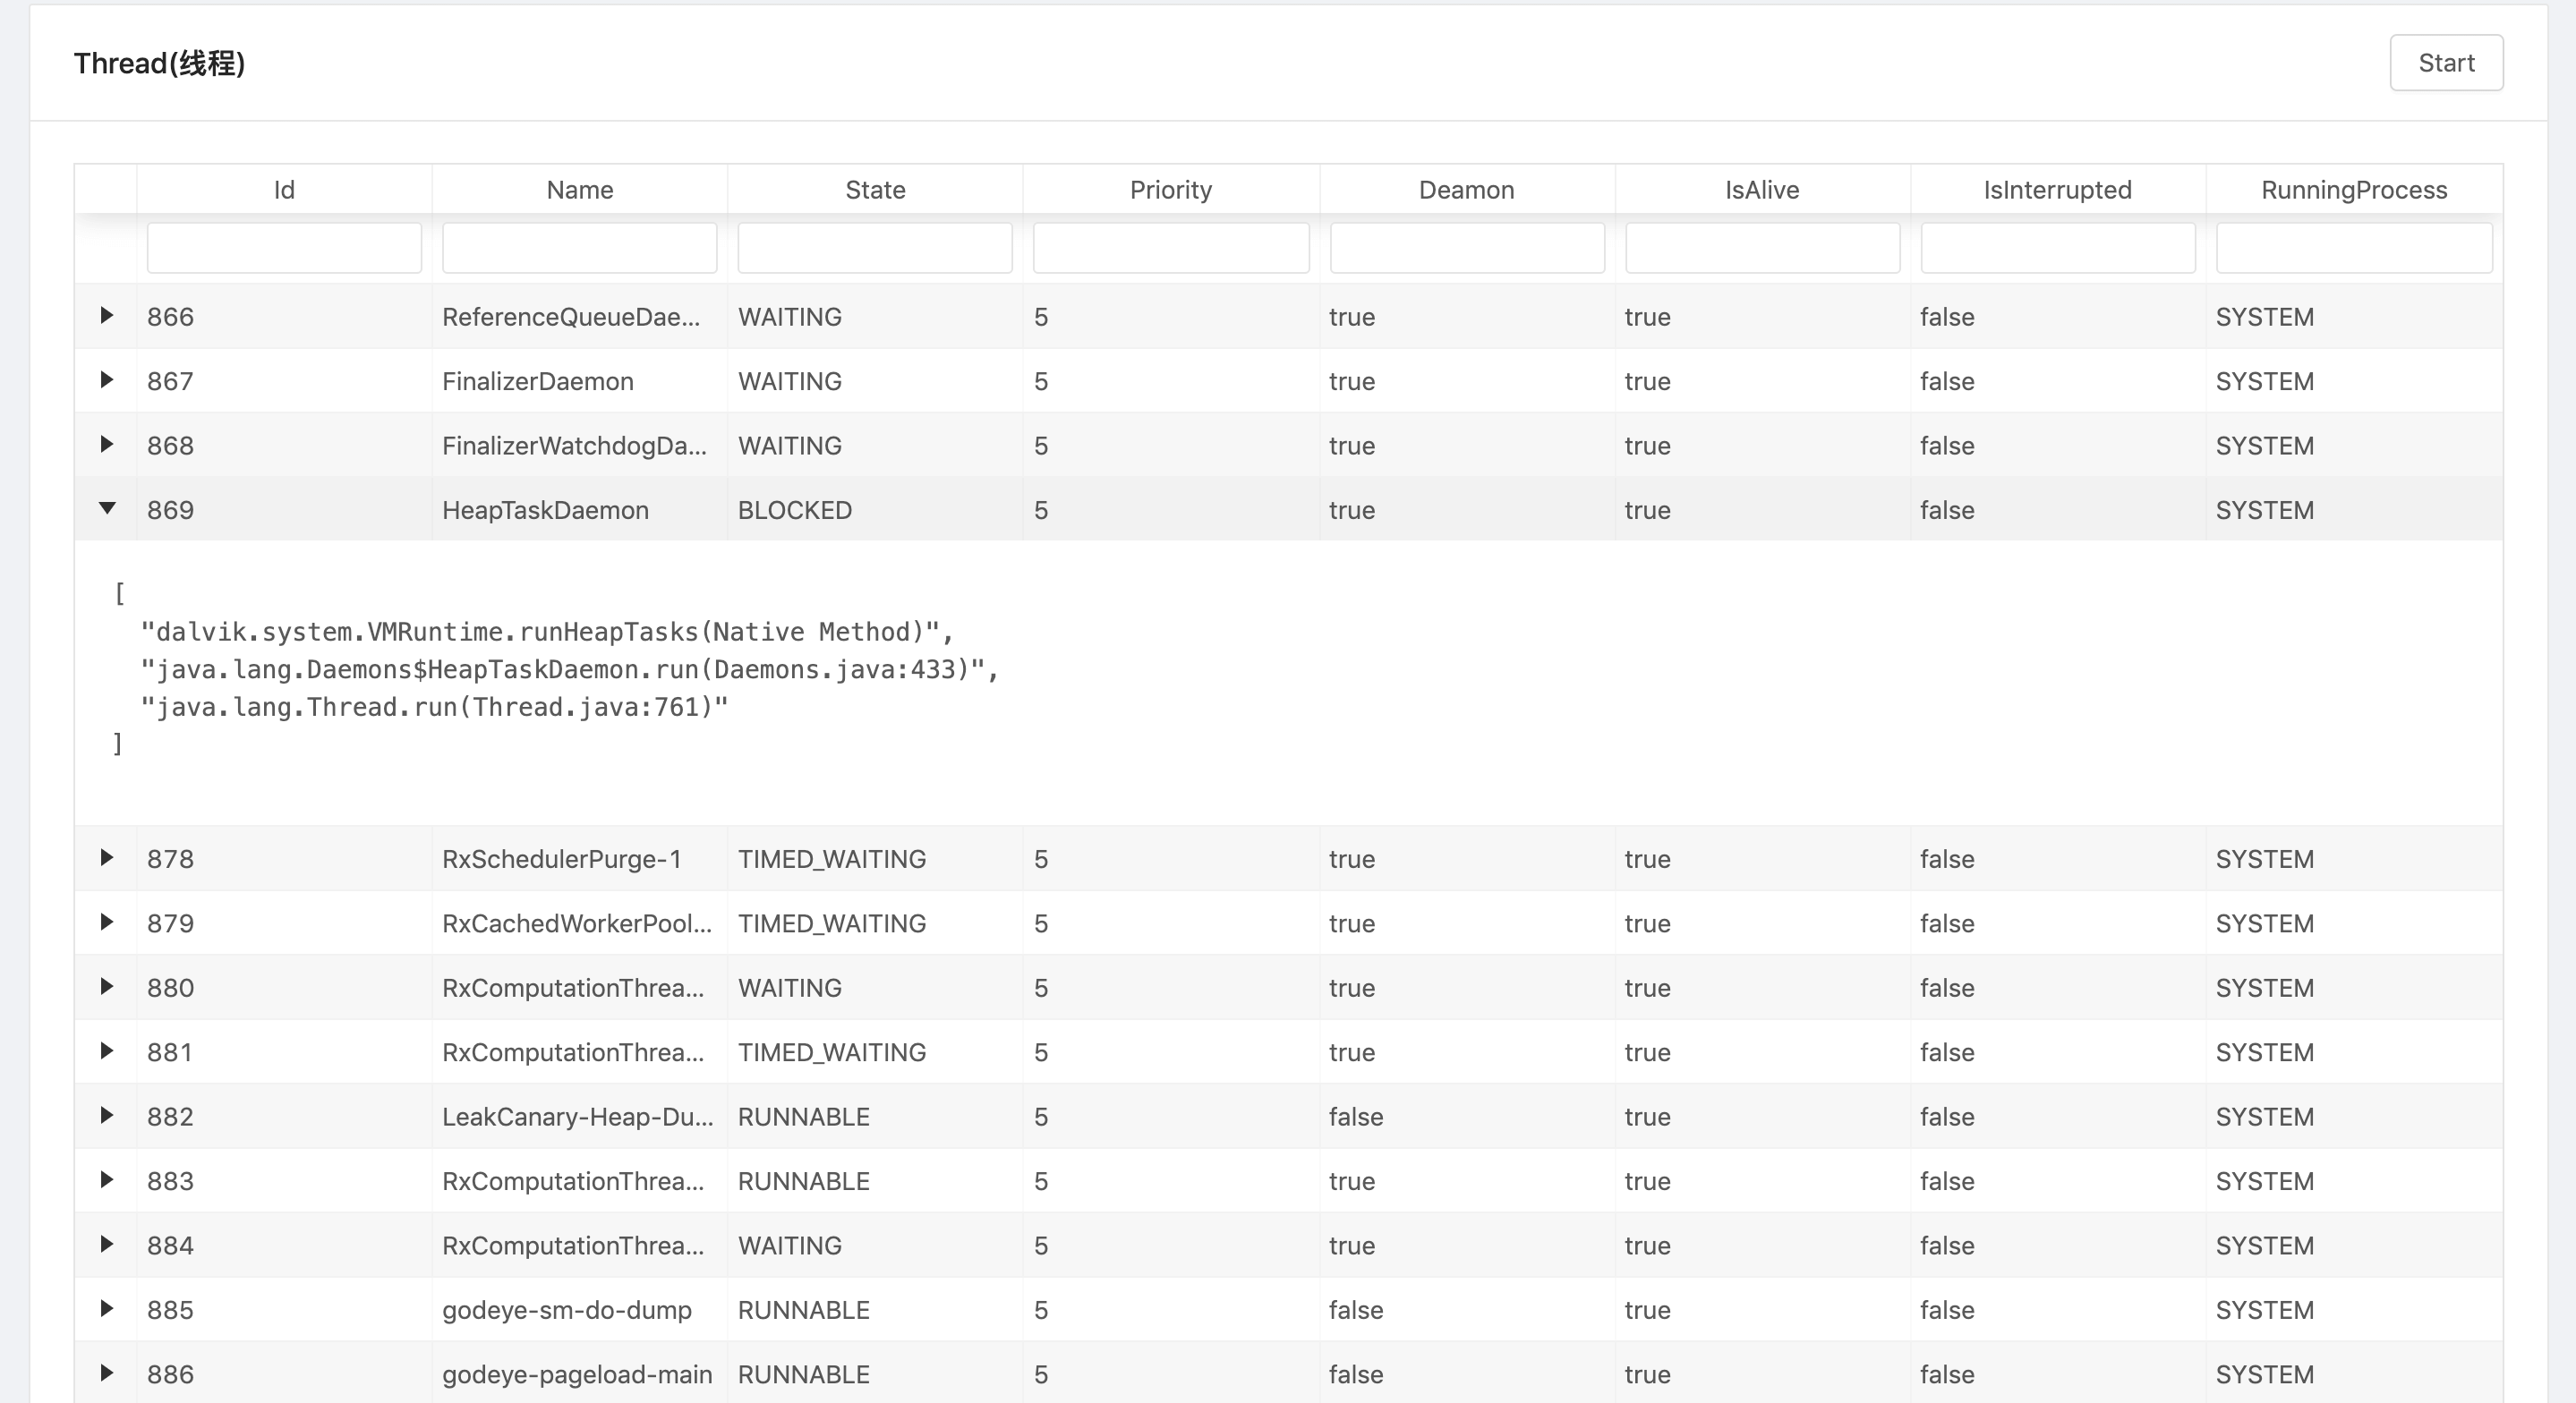
Debug Monitor实际上也是一种Consumer,它消费AndroidGodEye SDK产生的数据并通过websocket和http传输到浏览器前端看板
打开Dashboard的有几种方式:
- (推荐)Android Studio Plugin: 在Android Studio的插件管理中搜索
AndroidGodEye安装即可,或者下载android-godeye-idea-plugin.jar进行本地安装 - windows使用bash脚本: AndroidGodEye_plugin.bat
- unix使用sh脚本: AndroidGodEye_plugin.sh
- 手机和电脑用USB连接,并执行
adb forward tcp:5390 tcp:5390,然后在pc浏览器中访问http://localhost:5390/index.html(注意:/index.html 是必须加上的)就可以看到开发者面板了。如果没有USB线,也可以直接访问http://手机ip+端口+/index.html,当然,必须确保手机和pc在同一局域网网段
DebugMonitor的时候端口默认为5390,如果产生端口冲突的话可以通过更改资源<integer name="android_god_eye_monitor_port">5390</integer> 或者下面这样配置:
buildTypes {
        release {
            resValue("integer", "android_god_eye_monitor_port", "5390")
        }
    }