DebugAndLog
There are many ways to debug your NPL scripts, such as -- printing logs at compile time or execute code at runtime, via NPL Code Wiki. -- using HTTP GUI debugger via NPL Code Wiki or using a GUI debugger like visual studio or vscode, etc.
log.txt file is the most important place to look for errors. When your application starts, NPL runtime will create a new log.txt in the current working directory.
There is a helper library for debugging code here. For example, you can print call stack to log file like below.
echo(commonlib.debugstack(2, 5, 1))When using luajit, callstack and GUI debugging is not available in the function where you are doing a tail call, see here.
One can avoid tail call by adding () like below if your tail function has zero or 1 return value
function print_error_call_stack()
   echo({"error back tracing", commonlib.debugstack(2, 5, 1)})
end

function some_function_wrong()
   return print_error_call_stack();  -- this is tail call. stack info of this calling fucntion is lost
end
some_function_wrong()

function some_function_right()
   return (print_error_call_stack());  -- this is not a tail call. stack info of calling function is preserved
end
some_function_right()The entire Unix system is built on top of the philosophy of rule of silence, which advocates every program to output nothing to standard output unless absolutely necessary.
So by default, NPL runtime output nothing to its standard output. All NPL output API like log, print, echo write content to log.txt instead of standard output. There is only one hidden API io.write which can be used to write to standard output.
By default, NPL runtime and its libraries output many lines to log files. This log file can grow big if your server runs for days. There are two ways to deal with it: one is to use a timer (or external shell script) to backup or redirect log.txt to a different file every day; second is to change the default log level to error, which only output fatal errors to log.txt. Application developers can also write their own logs to several files simultaneously, please see script/ide/log.lua for details.
When application starts, one can also change the default log file name, or whether it will overwrite existing log.txt or append to it. Please refer to log interface C++ API for details.
The default log level of NPL is TRACE, which will write lots of logs to log.txt. At development time, it is good practice to keep this file open in a text editor that can automatically refresh when file content is changed.
When you feel something goes wrong, search for error or runtime error in log.txt. NPL Code Wiki provide a log page from menu:view:log, where you can filter logs. See below:

Many script programmers prefer to insert echo({params, ...}) in code to output debug info to log.txt, and when code is working, these echo lines are commented out.
A good practice is to insert permanent log line with debug level set to debug like LOG.std(nil, "debug", "modulename", "some text", ...).
There are two versions of NPL console.
- One is build-in console. One can invoke it by pressing
F12in paracraft. - The other is HTTP console. One can invoke it by pressing
F11in paracraft.
One can run any code or web page at runtime. One can also debug these temporary code by opening the file temp/console.lua in HTTP debugger. See NPL Code Wiki for more information.
Sometimes inserting temporary log lines into code can be inefficient. One can also use NPL HTTP debugger to debug code via HTTP in a HTML5 web browser with nice GUI. NPL HTTP Debugger allows you to debug remote process, such as debugging linux/android/ios NPL process on a windows or mac computer. See NPLCodeWiki for details.

If you have installed NPL/Lua language service for visual studio, one can set HTTP-based breakpoints directly inside visual studio.
In visual studio, open your NPL script or page file, right click the line where you want to set a breakpoint, and from the context menu, select NPL Set Breakpoint Here.

If you have started your NPL process and start the default web server, visual studio will open the HTTP debugger page with your default web browser. This is usually something like http://localhost:8099/debugger. Breakpoints will be automatically set and file opened in the browser.

If you are running paracraft, one can also add httpdebug="true" to the command line to automatically start the default web server at port 8099 on startup. Or in your custom app, one can manually call WebServer:Start("script/apps/WebServer/admin", host, port); like below to start the web server.
-- force debugger interface at startup
if(ParaEngine.GetAppCommandLineByParam("httpdebug", "") == "true") then
	local host = "127.0.0.1";
	local port = "8099"; -- if port is "0", we will not listen for incoming connection
	NPL.load("(gl)script/apps/WebServer/WebServer.lua");
	WebServer:Start("script/apps/WebServer/admin", host, port);
	LOG.SetLogLevel("DEBUG");
	LOG.std(nil, "debug", "main_loop", "NPL Network Layer is started  %s:%s", host, port);
end For more, information, please see https://github.com/tatfook/vscode-npl-debug
Visual studio plugin is NO longer supported. Please use NPL http debugger in web browser. We may resume this plugin dev in future.
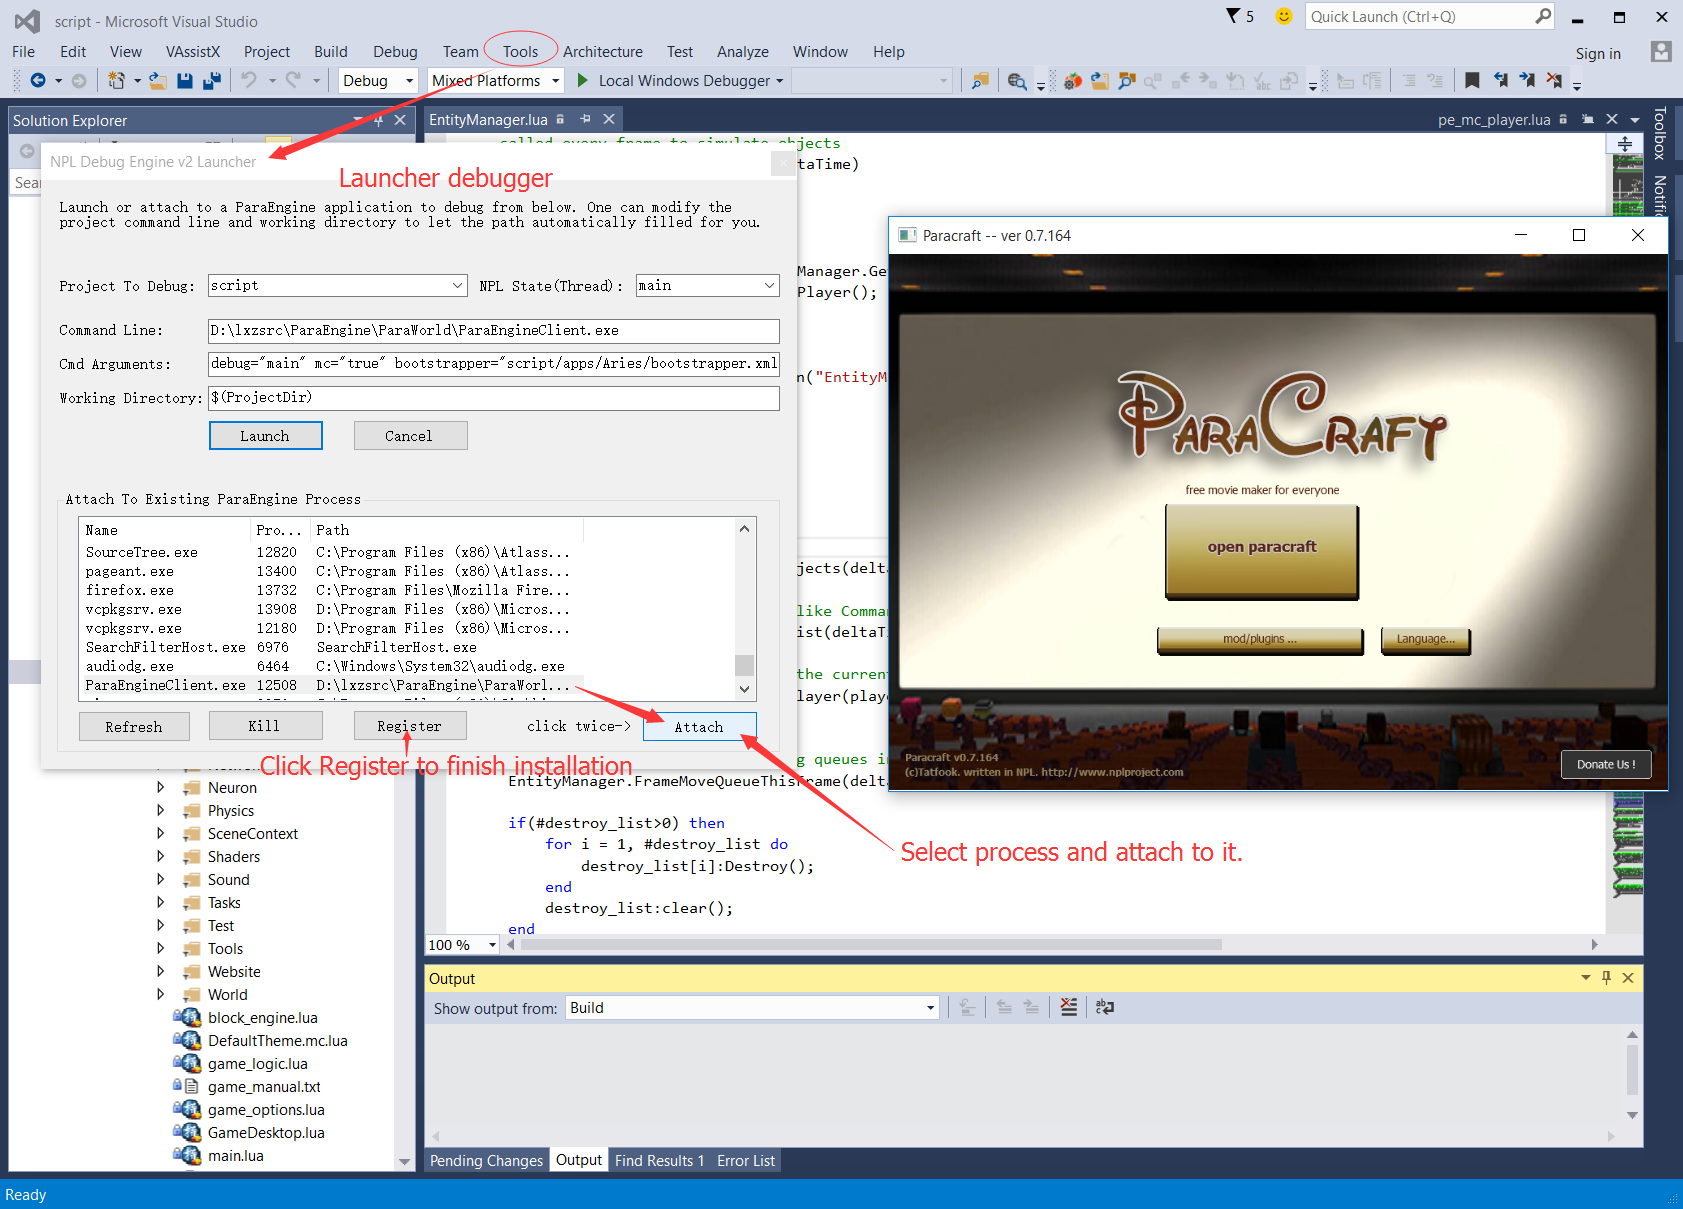
We also provide open source NPL debugger plugins that are integrated with visual studio and vscode, see InstallGuide for details.However, it is a little complex to install visual studio debugger plugin, please follow instruction here: How To Install NPL Debugger for VS
Once installed, you can debug by selecting from visual studio menu Tools::Launch NPL Debugger...
To write and debug NPL packages, one can start NPLRuntime in a development directory like below. Git clone all your packages to npl_packages/ folder. For example, your dev directory c:\myproject\ may look like below.
npl_packages/main/
npl_packages/paracraft/
main_*.pkg <-- precompiled package which you may not have source code
other resource or executable data files
Then you can start debugging code via command
[your_exe] dev="c:\myproject\"
It is important to start using dev parameter, otherwise main_*.pkg has higher priority than package search path if dev is not specified.
Optionally, one can force loading package during start up with command line like:
[your_exe] dev="c:\myproject\" loadpackage="npl_packages/main/,npl_packages/paracraft/"
For more information on debugging related command line parameter, please refer to command line