Quick Start Guide
Aegean is a program that is designed to detect and characterize sources within radio images.
Radio images are very rarely as nice as anything that you'd see on APOD. They are typically just a bunch of bright blobs with more faint blobs in the background. Case in point is the image in the figure below. There are some obvious bright blobs, most of which look circular, and one of which looks like a slug. The rest of the image just looks like a smoothed stucco pattern. Note that the image doesn't have a sharp salt and pepper kind of noise, but a more smooth bubbly kind of noise. This is because radio telescopes have limited resolution so emission from nearby regions are blurred together.
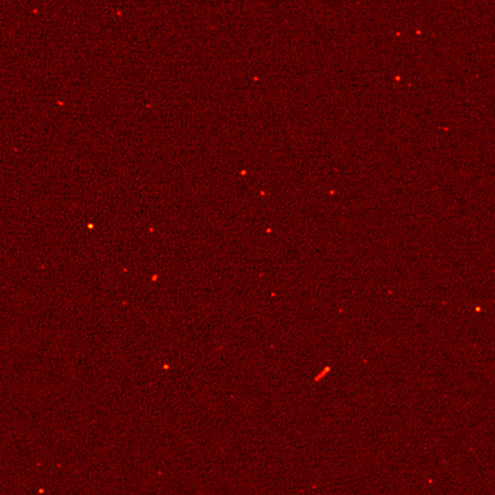
The background rumble that is seen above is due to noise fluctuations in the radio telescope, where as the bright blobs are interesting astrophysical sources - usually galaxies. The galaxies are so distant, and the resolution of radio telescopes is so poor, that even super-massive black-holes at the center of enormous galaxies will just look like a single blob in an image. To learn about the radio galaxies we look at their brightness at a range of different frequencies to build up a sort of radio spectrum. Because we understand how radio emission is produced, we can take a radio spectrum, or even just two or three points on the spectrum, and say something physically interesting about the radio source. The better that we are able to measure the brightness of sources at different frequencies, the better we can understand the radio sources. This is where Aegean comes in.
Aegean takes an image such as the one above and automates the process of finding and measuring all the sources. It does this in three stages:
- Characterize the background and noise properties of the image. (see BANE).
- Select all the pixels in the image that are significant deviations from the background, and group all such adjacent pixels into groups. We call these groups islands.
- For each island - determine how many blobs are required to describe the island, and fit the parameters of each blob.
- Report the results in a nice format that can be used with other program.
The noise in the image above is a measure of the rumble in the background. Another way of thinking about this is to take all the pixels in the image, and make a histogram of their brightness. We expect that this histogram will have a Gaussian distribution. The mean of the distribution tells you about the emission that is 'everywhere', this is the background emission, and it is typically zero when we look outside of our Galaxy. The width of the distribution tells you about the noise in the image or the 'rms' level. If we consider the fact that there are pixels in the image that correspond to real sources, then we expect that our histogram will have a long tail towards high flux values. Now it is possible that the background and noise properties vary across our image, some parts of the sky are more crowded than others, some parts have more large scale diffuse cloud-like emission, and our telescopes usually have different sensitivity to different parts of the sky. All this means that we need to calculate the background and noise properties as a function that varies across the image. There are a number of ways to do this. We can use theory and modelling to work out the expected levels (hard/boring/inacurate) or we can just look at the image itself (easier/more accurate). The Background And Noise Estimation program (BANE) was designed to do just this and is described elsewhere.
Regardless of how you measure the background and noise properties of an image, it is possible to point Aegean to these images using either the --background file.fits and --rms file.fits options or using the --autoload function. These options are discussed briefly here.
Aegean takes the input image and subtracts the background from it. This should result in an image that has zero mean, with deviations from zero either due to noise or real sources. We use statistics to determine whether a non-zero pixel is due to noise or real sources, and this is where the noise image comes in. If we assume that the noise is Gaussian then there is a clear link between the value of a pixel, the local noise in the image, and the probability that the pixel is part of a real source. If a pixel is more than 5 standard deviations (sigmas) from the mean then there is a roughly 1 in 1.7 Billion chance that this is due to noise. So we now define all pixels with a flux of at least 5 times the local noise to be significant. In terms of the original image data significant pixels satisfy: flux >= 5*noise + (data-background).
Aegean takes all the significant pixels in the image and groups them together using a Labelling algorithm. We refer to each of these groups of pixels as an island.
For each island of pixels Aegean needs to first decide how many components are going to be fit. This is done by looking at the local min/max of the image. When we look at an island of pixels we can then ask, how many of these pixels are local min/max. We then use the label algorithm again to make groups of pixels with negative curvature. I think of islands as being cartoon-like desert islands with snow covered mountains on them, so I refer to these local maxima as summits.
For each summit within an island Aegean will fit a single component. Most islands only get one component. Each component is a blob that initially has the same shape as our resolution element, which is an elliptical Gaussian. Thus each island is fit with one or more elliptical Gaussian components, each of which have six parameters. The parameters are position (x/y), peak, major and minor axis size, and rotation angle. These pixel values are then translated into astronomical quantities of RA/DEC, peak flux density (Jy/beam), major minor axis FWHM and position angle.
Aegean takes all the fitted parameters, the background and noise information, and extra information from the image file header, and makes as complete a report as possible of all the sources that were found. The parameters that are reported are listed here.
Since there is no one data format that is used by all astronomers or by all astronomy software, Aegean can report the above results in a variety of formats as described here. The format of the files is largely irrelevant, as the data contained within is the same.
Well Step 1 is to Download and Install Aegean.
Ok so you have an image that you want to do some source finding on, lets all it image.fits. Step 1 is to run BANE on the image to measure the background and noise properties. Do this by running BANE image.fits. You will get some output to screen which should end with a message saying that image_bkg.fits and image_rms.fits were written. So long as you don't change the filenames you can run Aegean using aegean --autoload image.fits --table out.vot. This will create a new file called out_comp.vot. I know it's not exactly the filename that you asked for, but since Aegean can do multiple different kinds of fitting (see other docs) I needed some way to differentiate the different types of output. Here _comp means 'component', so each row in this table will correspond to a single component. So now you are done, you have used Aegean to find sources within an image and you have some results.