7 monitoring
-
1.1. Prometheus
1.2. Grafana
1.3. Grafana Loki
-
3.1. Logging
3.2. Exporting Metrics
3.4. Demo
3.5. Dashboards
- A monitoring system that pulls (retrieves) metrics data (entries of types counter, gauge, histogram, and summary) by running a job against one or more instances and stores these data in a time-series database.
- Client libraries written in different programming languages can be used to export application metrics while exporters export metrics data from different systems (e.g., a Linux server or a database).
- Metrics database can be queried (using PromQL) manually through the web UI or automatically by a visualization and analytics system (e.g., Grafana) or used to configure alerting rules that are handled by the alert manager.
- A web application used mainly for visualization and analytics. Once deployed (e.g., as a docker image), it provides a nice UI for creating and customizing dashboards with panels (containing graphs, bars, gauges, charts, etc.) to visualize metrics or logs collected by a monitoring solution (e.g., Prometheus or Grafana Loki) from different systems or databases.
- It can be used to configure alerts and has a plugin system to extend its functionality and integrate with other tools.
- A monitoring solution like Prometheus, but focused on application logs (collected by clients) instead of general metrics.
- Logs are stored as compressed objects and indexed for high efficiency, they can be queried using LogQL.
- Prepare a monitoring and visualization environment for the apps as a network of containers (application + Grafana + Prometheus + Loki with Promtail client).
- Configure Loki to monitor logs from all running containers and Prometheus to monitor metrics of itself, Loki, and the application.
- Create a Grafana dashboard to visualize the scraped data.
- Make sure the application generates logs that can be accessed when running the container.
- (Optional) write code to generate application-specific logs:
-
Python App: Flask provides
Flask.Loggerwhich is a standardlogging.Logger -
NodeJS App:
consoleutilities fordebug,warn, anderrorcan be used.
-
Python App: Flask provides
- An HTTP endpoint for application metrics need to be exposed by the application for scraping by Prometheus.
- We can define our own metrics and export them using client libraries for Python and NodeJS, or use 3rd party exporters like prometheus-flask-exporter for Python app and swagger-stats for NodeJS app.
- Write a docker-compose.yml for deploying the application with the logging and monitoring stack in a single network [ref.].
- Write configuration files for Loki [ref.], Promtail [ref.], and Prometheus [ref.] and copy them to containers or use a volume.
- Loki configuration specifies internal settings for Loki server and where to store logs (locally or remotely).
- Promtail configuration contains information on the Promtail server, where positions are stored, and how to scrape logs from files.
- Prometheus configuration defines target endpoints to scrape and how often to scrape them.
- Run the 3 containers with a
commandthat specifies config file location.
-
Run
docker-compose upand verify that all containers are running. -
Verify the application is running at http://localhost:8080
-
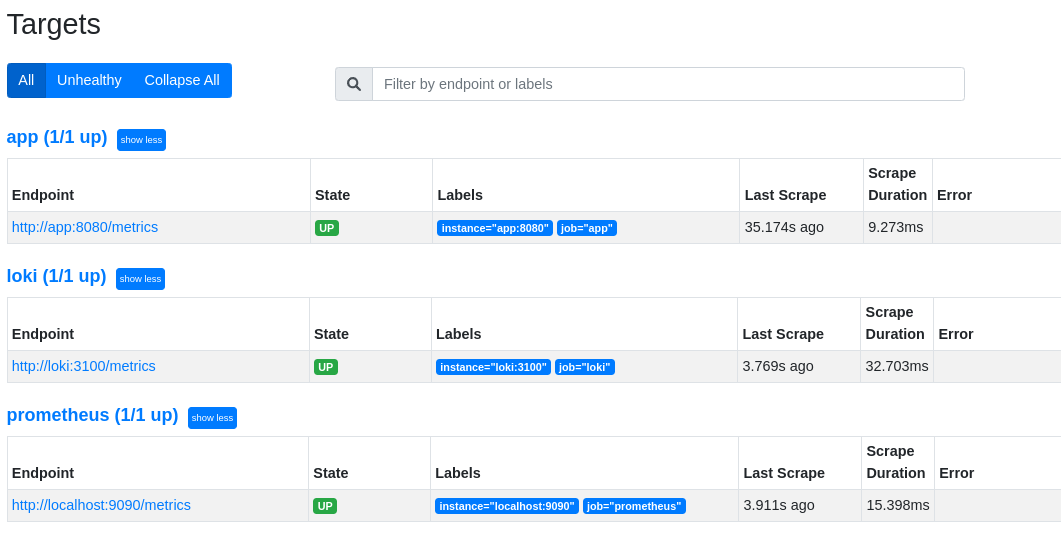
Verify Prometheus UI is accessible at http://localhost:9090 and all targets are up in status tab, you can also run queries with autocompletion.
-
Verify Grafana UI is accessible at http://localhost:3000
- Default credentials:
admin:admin
- Default credentials:
-
Configuration → Data source → Add data source
-
→ Loki → URL =
http://loki:3100→ Save and test. -
→ Prometheus → URL =
http://prometheus:9090→ Save and test.- We can also add built-in Prometheus stats dashboard.
-
-
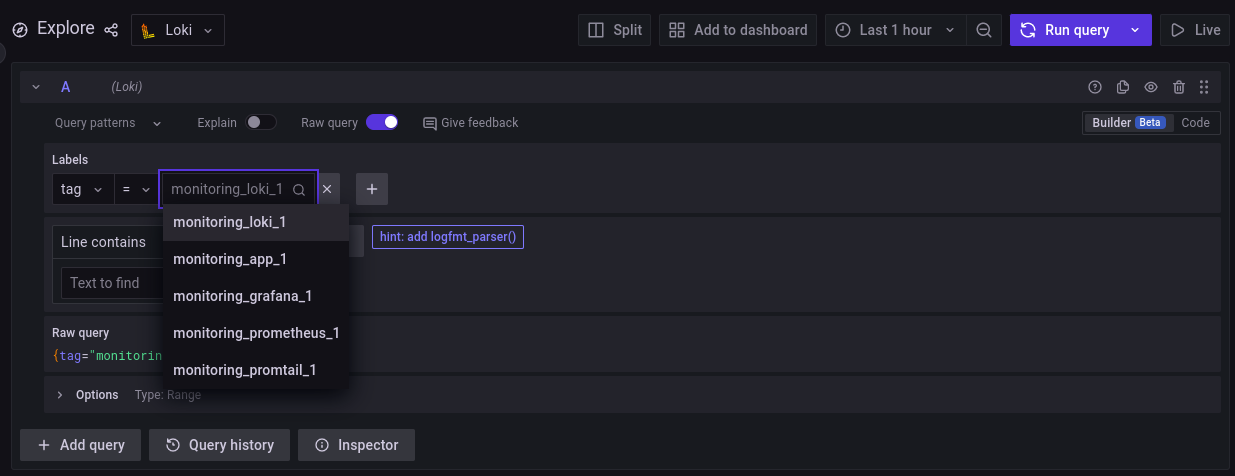
Explore → Loki → Add query → Write PromQL query or use UI builder.
-
We can see that container logs were scraped successfully.
-
Example query that shows application logs
{tag="monitoring_app_1"}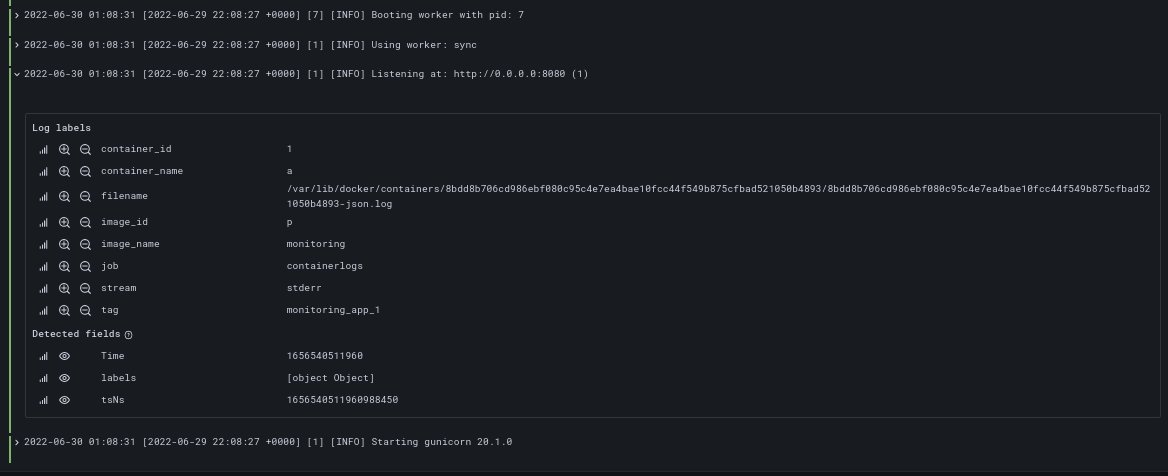
-
Example query showing application endpoint responses:
sum by(status) (flask_http_request_total)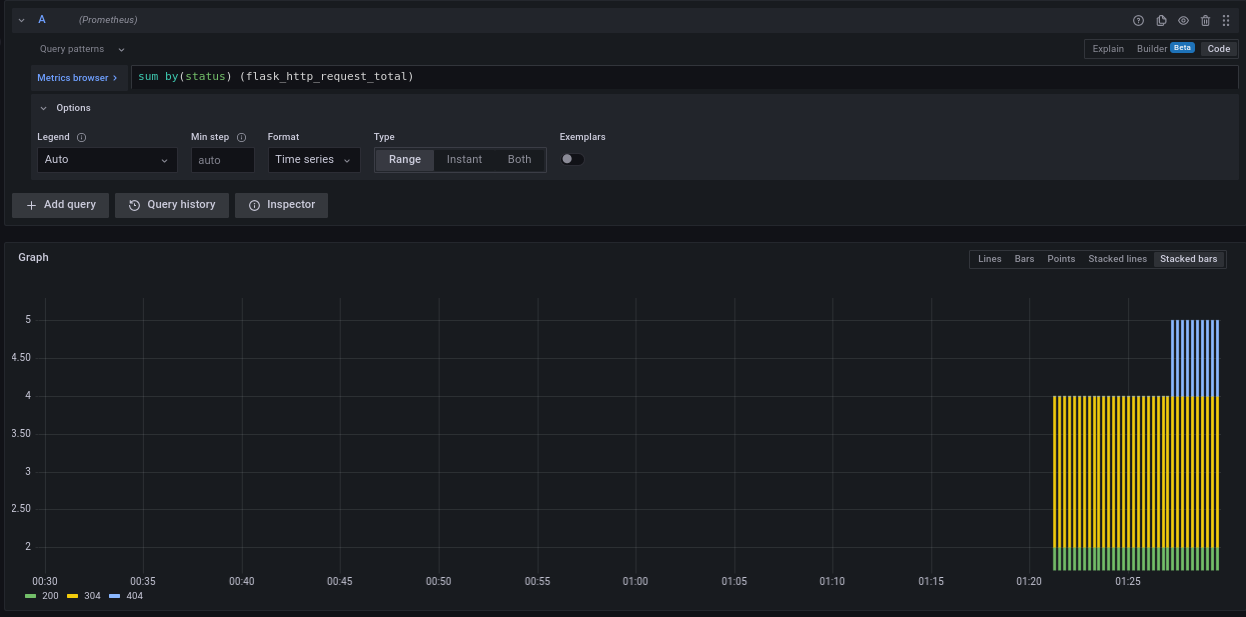
-
-
Now we can create interesting dashboards from data collected by Prometheus and Loki and export them as reusable JSON.
-
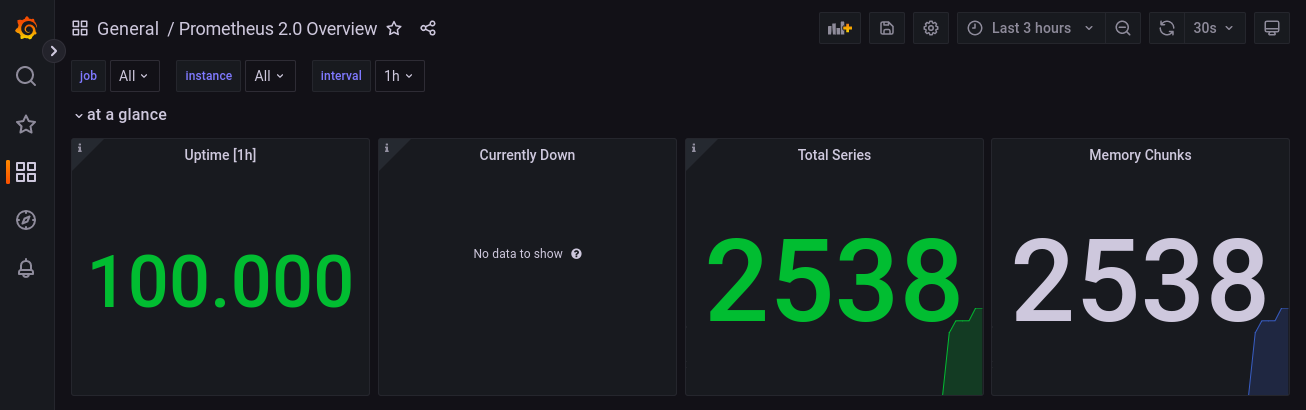
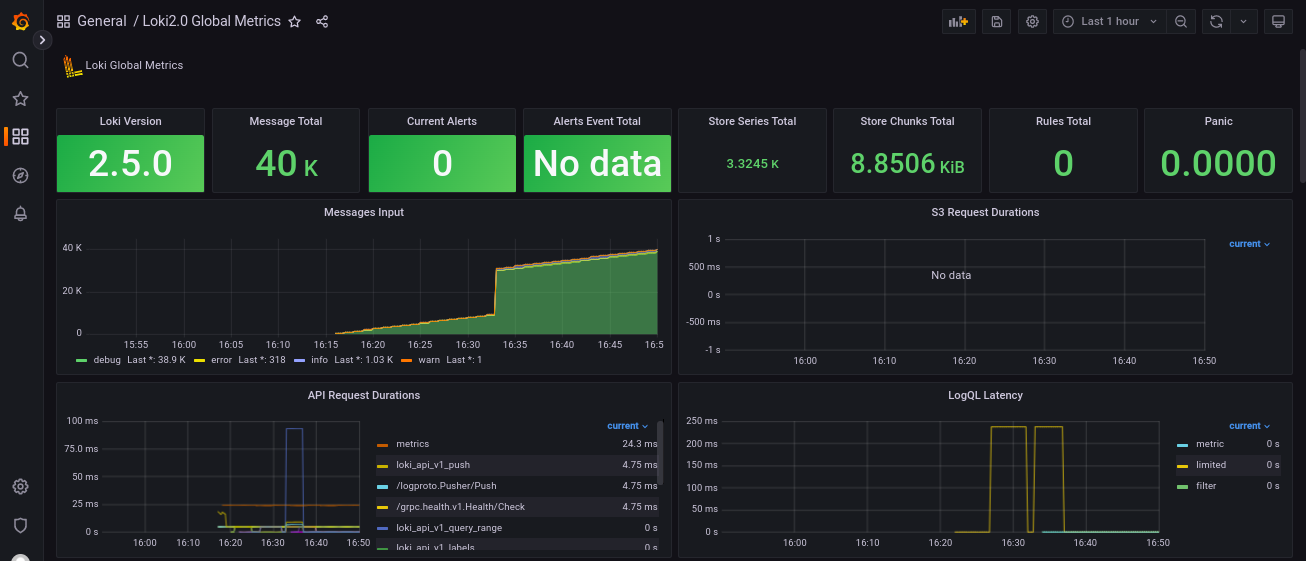
We can also import ready-to-use dashboards for monitoring loki and prometheus
- Dashboards → New → Import → Upload JSON File.
-
Application dashboard created from Grafana UI.
- Left panel has type
Logsand uses Loki data source with query:{tag="monitoring_app_1"} - Right panel has type
Pie Chartand uses Prometheus data source with querysum by(status) (flask_http_request_total)exported byprometheus-flask-exporterfor the Python app. - Dashboard can be exported from settings (gear icon) → Save Dashboard
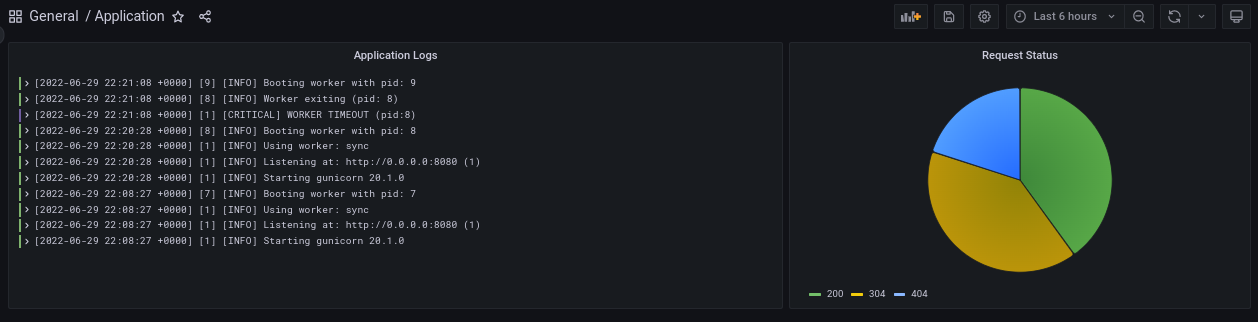
- Left panel has type
-
Dashboards for Prometheus and Loki
-
Note that metrics names or Grafana dashboard types may change over time, rendering panels with no data. Queries need to be modified accordingly to reflect latest changes.
-
- Official guides: Grafana, Loki, Prometheus.
- Create descriptive logs that follow a common format.
- Implement log rotation to save memory and disk space.
- Create simple, easy to interpret dashboards with meaningful names.
- When configuring alerts, try to have them triggered only when attention is needed.
- Avoid unnecessary dashboard reloading to reduce network load.
- Metric names for Prometheus should have a (single-word) application prefix relevant to the domain the metric belongs to.