8 container orchestration
-
1.1. Kubernetes
1.1.1. Overview
1.1.2. Common API Resources
1.1.3. Highlighted Properties
1.2. Helm
-
3.2. Writing Helm Charts
3.3. Secret Management
- Kubernetes is a system for automating software deployment, scaling, and management.
- A typical use case involves the deployment of different objects (expressed as YAML files describing the desired object specification) on nodes (virtual or physical machines) inside the cluster that is controlled and managed by the master node which stores information about the cluster state in etcd database and exposes an API that can be interacted with from the command-line using
kubectl.
-
Common object kinds (check
kubectl api-resources)Object Overview Pod Represents a logical host that typically runs one containerized application, but may run additional sidecar containers. ReplicaSet Ensures that a specified number of pod replicas are running at one time. Deployment Represents an application running in the cluster, provides declarative updates for Pods and ReplicaSets. Service Represents a network service that makes a set of pods accessible using a single DNS name and can load-balance between them. ConfigMap An API object used to store non-confidential data as key-value pairs that are accessible by pods (e.g., as environment variables). Secret Similar to ConfigMaps, but are specifically intended to hold confidential data (e.g., passwords and tokens). Ingress An API object that manages external access to the services in a cluster, typically HTTP. StatefulSet A deployment for stateful applications; provides guarantees about the ordering and uniqueness of deployed Pods. DaemonSet DaemonSet ensures that a copy of a certain pod (e.g., logs collector, metrics exporter, etc) is available on every node in the cluster. PersistentVolume Abstraction of a persistent storage that can use a local or remote (cloud) storage as a backend. Pods can acquire portions of that storage using a PersistentVolumeClaim LimitRange Enforces minimum and maximum resource usage limits per pod or container in a namespace.
-
Service.spec.type[ref.]-
ClusterIP(default): exposes the service only internally by giving it a cluster-internal IP.-
Headless Service: a ClusterIP service with
.spec.ClusterIP: "None". It is typically used with a StatefulSet to make pods addressable by a hostname as it’s needed to maintain pod identity.
-
Headless Service: a ClusterIP service with
-
NodePort: expose the service on each Node's IP at a static port (.spec.ports[*].nodePort) -
LoadBalancer: creates a provider-specific load balancer between pods selected by the service. -
ExternalName: creates a CNAME DNS record for the service with name.spec.externalName.
-
-
Pod.spec.strategy.type(how k8s replaces old pods with new ones)-
RollingUpdate(default): creates extra pods (not more than.spec.strategy.rollingUpdate.maxSurge) to replace old (terminating) ones while not exceeding amaxUnavailablenumber/percentage of running pods. -
Recreate: fully terminate old pods before starting new ones, implies downtime.
-
-
Pod.spec.nodeSelector- Pods can be assigned to any node in a cluster, a
nodeSelectorrestricts a certain pod to only run on nodes having certain labels assigned to certain values.
- Pods can be assigned to any node in a cluster, a
-
Pod.spec.affinity.nodeAffinityandPod.spec.tolerations- Node affinity expands the concept of nodeSelector to match based on constraints other than labels (e.g., this pod can only run on nodes in this geographical location).
- Tolerations specify whether a certain pod tolerate a certain node taint.
- Node taints are rules attached to a node (e.g., this node has a certain hardware, any pod that does not tolerate this hardware shall not be scheduled on that node).
- Taints can be added to nodes using
kubectl taint
-
Pod.spec.affinity.podAffinityandPod.spec.affinity.podAntiAffinity- Sets affinity constraints based on pod properties instead of node properties.
-
A package manager for k8s: allows packaging and reusing an existing k8s architecture/manifest as a bundle of YAML files called an Application Chart and upload it to a public/private registry (e.g., ArtifactHub).
- Library charts on the other hand are not meant for deployment, they are typically included as dependencies to other charts to allow reusing snippets of code across charts and avoid duplication.
-
A templating engine: the packaged YAML files can use the Helm templating language that can generate different k8s manifests from the same source file through values files.
-
Basic Directory structure of a helm chart:
mychart/
  templates/   # YAML bundle (where .Values object is accissble)
  charts/      # Chart dependencies
  Chart.yaml   # Chart metadata: name, version, dependencies, etc.
  values.yaml  # Default values for the template files
-
Deploy an application in minikube using the command line and using a manifest.
-
Create a helm chart from the previously-created manifest.
-
Create a secret (e.g., for DB username and password) and inject it as an environment variable to the deployment pods.
-
Set LimitRanges for CPU and memory usage on pods.
-
Create a ConfigMap with some JSON data and mount it as a volume.
-
Modify applications so that they do something persistent, and create a StatefulSet to manage their state.
-
Use an init-container to download a file and inject it into an application container.
-
Deploy Kube-Prometheus-Stack to monitor k8s and manage alerts.
-
Run
minikube startto start a local k8s cluster and configurekubectlto interact with it. -
Create a deployment for the Python (or NodeJS) application.
kubectl create deployment python-app --image=sh3b0/app_python
-
Create an external service to make the app accessible from outside.
kubectl expose deployment python-app --type=LoadBalancer --port=8080
-
Show created objects
$ kubectl get all # or kubectl get pod,svc to show only pods and services
NAME                             READY   STATUS    RESTARTS   AGE
pod/python-app-cc8f9dc84-rvkmb   1/1     Running   0          9m28s

NAME                 TYPE           CLUSTER-IP     EXTERNAL-IP   PORT(S)          AGE
service/kubernetes   ClusterIP      10.96.0.1      <none>        443/TCP          13d
service/python-app   LoadBalancer   10.108.44.57   <pending>     8080:31302/TCP   6m29s

NAME                         READY   UP-TO-DATE   AVAILABLE   AGE
deployment.apps/python-app   1/1     1            1           9m28s

NAME                                   DESIRED   CURRENT   READY   AGE
replicaset.apps/python-app-cc8f9dc84   1         1         1       9m28s
-
When deploying on cloud, an external IP for the service will be available. For testing with minikube, run the following command to get a URL for accessing the service.
minikube service python-app --url
-
Remove created objects
kubectl delete service/python-app
kubectl delete deployment.apps/python-app
-
Create deployment.yaml and service.yaml inside
k8s/minikubedirectory to do the same from configuration files instead of stdin. -
Apply configuration and check results
$ kubectl apply -f deployment.yaml -f service.yaml
deployment.apps/app-deployment created
service/app created

$ kubectl get all
NAME                                  READY   STATUS    RESTARTS   AGE
pod/app-deployment-69cfdc7ff9-lkhpk   1/1     Running   0          9s
pod/app-deployment-69cfdc7ff9-v287x   1/1     Running   0          9s
pod/app-deployment-69cfdc7ff9-vshs6   1/1     Running   0          9s

NAME                 TYPE           CLUSTER-IP       EXTERNAL-IP   PORT(S)          AGE
service/app          LoadBalancer   10.106.183.183   <pending>     8080:32442/TCP   12s
service/kubernetes   ClusterIP      10.96.0.1        <none>        443/TCP          13d

NAME                             READY   UP-TO-DATE   AVAILABLE   AGE
deployment.apps/app-deployment   3/3     3            3           9s

NAME                                        DESIRED   CURRENT   READY   AGE
replicaset.apps/app-deployment-69cfdc7ff9   3         3         3       9s
-
Install helm and navigate to
k8s/helm -
Create chart files and directories manually or use
helm create app-deploymentto add some boilerplate. -
Copy the previously-created YAMLs to
templatesdirectory, parametrize them and put default values in values.yaml -
Example use case: deploy nodejs app for the chart
cd k8s/helm
helm install --set image=sh3b0/app_nodejs:latest my-chart ./app-deployment

helm list            # to see installed charts
minikube dashboard   # opens a web UI for debugging
-
To store secrets (e.g., database user and password) in k8s, create a secret object:
# Create secret from files (should be ignored from the VCS).
$ kubectl create secret generic db-user-pass \
  --from-file=username=./username.txt \
  --from-file=password=./password.txt
secret/db-user-pass created

# Verify secret exists
$ kubectl get secrets
NAME           TYPE      DATA   AGE
db-user-pass   Opaque    2      3s

# Show secret (decoded from base64)
$ kubectl get secret db-user-pass -o jsonpath='{.data.username}' | base64 -d
admin
-
Secrets can be mounted as volumes or exposed as environment variables to pods.
-
The same is done:
- Using a manifest file at k8s/minikube/secret.yaml
- Using a template file at k8s/helm/secret.yaml
-
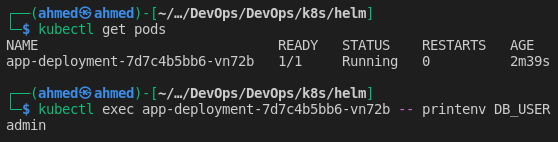
The secret values are read from values.yaml and mounted as environment variables in the application container using
container.envlist, an existing secret can also be used. -
Since that configuration section can be used frequently, it is defined as a named template
env.db_credsink8s/helm/app-deployment/templates/_helpers.tpland included in deployment.yaml with the proper indentation length. -
Verify the variables are accessible by pods.
-
-
A secret management tool like Hashicorp Vault is typically used in production to provide more control and security.
-
Create
k8s/minikube/limitrange.yamlwith request (min) and limit (max) cpu and memory usage for all containers. -
Apply configuration:
kubectl apply -f limitrange.yaml -
Check configuration is being used:
$ kubectl get pod/app-deployment-7d7c4b5bb6-vn72b -oyaml ... resources: limits: cpu: 500m memory: 128Mi requests: cpu: 500m memory: 128Mi ... -
The same is done using the helm chart (in
deployment.yamlresources map).
-
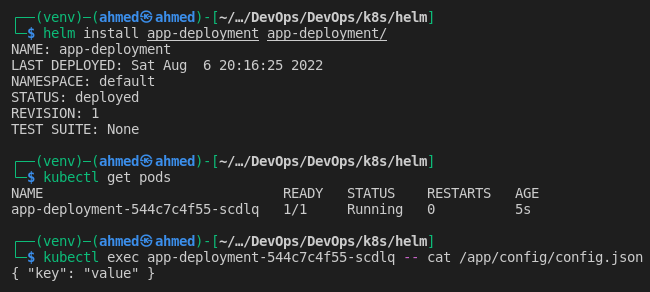
Applications may need config files to operate. Create a dummy config for testing
cd k8s/helm/app-deployment/
mkdir files
echo '{ "key": "value" }' > files/config.json
-
Create templates/configmap.yaml ConfigMap resource with the data from the JSON file.
-
Edit templates/deployment.yaml to mount
files/directory as a volume in/app/configin the app container. -
Install the chart and verify the file is available in the container.
-
Add stateful logic to the applications. For Python App, I added:
-
app.logstoring date and time for eachGET /request. -
db/visits.jsonstoring the number of times/was accessed by user. -
/visitsendpoint returning the content ofvisits.json
-
-
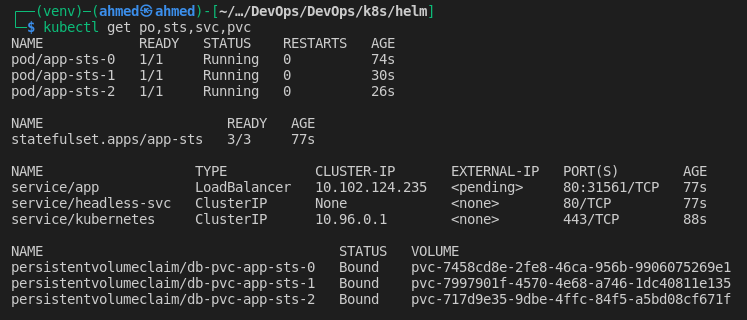
Create statefulset.yaml with a headless service, StatefulSet (example), and a PVC template mounted at
/app/db -
Deploy or upgrade the chart:
helm upgrade --install app-deployment app-deployment/ --values my_values.yaml
-
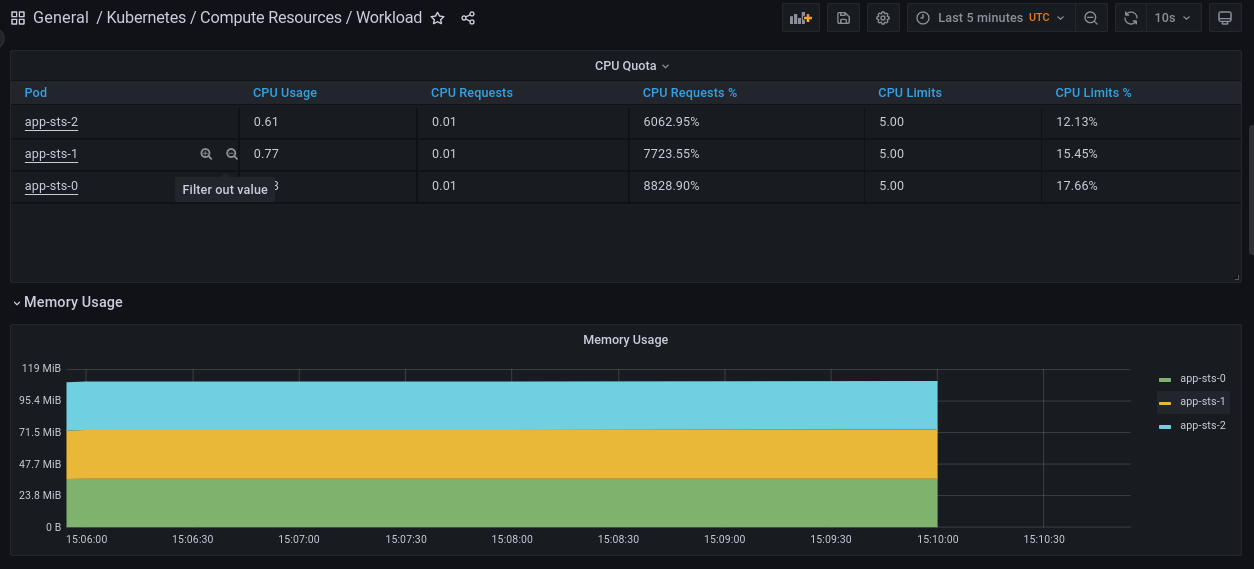
Show created resources
-
Test the service
# Get service address
$ minikube service app --url
http://192.168.49.2:31561

# Create some traffic using Apache Bench
# 114 requests, 5 requests at a time, 5 seconds before a request times out.
$ ab -n 114 -s 5 -c 5 http://192.168.49.2:31561/
-
Check
visits.jsonin different pods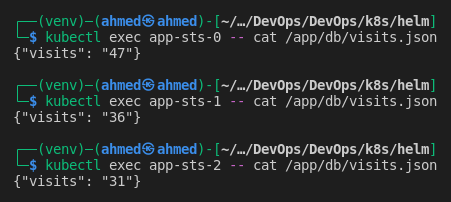
-
For this application, ordering of pods is not needed, it slows down the startup and termination, this can be avoided by setting
podManagementPolicyto"Parallel"in the StatefulSet spec.
-
For each pod in the StatefulSet, K8s will:
-
Create a PersistentVolumeClaim from the specified
volumeClaimTemplates -
Dynamically provision a PersistentVolume at the following
hostPathwith the same properties as the PVC./tmp/hostpath-provisioner/default/{volumeClaimTemplates.metadata.name}-{pod_name} -
Statically bind each PVC with a corresponding PV using
volumeNamein the PVC andclaimRefin the PV. -
Add a volume each pod named
{volumeClaimTemplates.metadata.name}which we already mounted on the pod usingvolumeMounts.
-
-
Concerns and Notes:
-
Security rists:
hostPathvolumes should be avoided overall because they allow access to the host node which introduces security risks. -
No multi-node clusters: this setup won’t work as expected when deployed on a cluster with multiple nodes,
localvolume types should be used instead ofhostPathfor this purpose. -
No persistence guarantees:
visits.jsonfor each pod will maintain state between pod restarts, but all data will be lost when the StatefulSet is deleted for any reason. -
No consistency guarantees: each pod will get its copy of the path on host and modify it separately, so accessing
/visitson the web will give inconsistent results. - All the above issues are addressed in production by using a remote storage (outside of k8s cluster) such as
nfsand managing data consistency in application logic (e.g., using master and slaves DB replicas where master is the only pod with write access).
-
Security rists:
-
Init containers run before the main containers in the pod, they can be used to do some initialization tasks.
-
Create a pod (
k8s/minikube/init-container.yaml) that runs an init container to download a file, save it to a volume, and access it from the main container.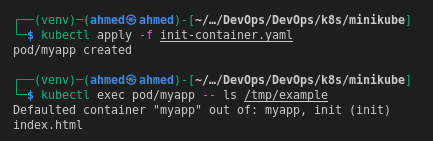
# Add prometheus-community repo to helm
helm repo add prometheus-community https://prometheus-community.github.io/helm-charts

# Update chart index
helm repo update

# Install kube-prometheus-stack in the monitoring namespace.
# Creating the namespace if required
helm install monitoring prometheus-community/kube-prometheus-stack -n monitoring --create-namespace-
Prometheus: the monitoring system scraping metrics from other components. The chart also deploys external related components:
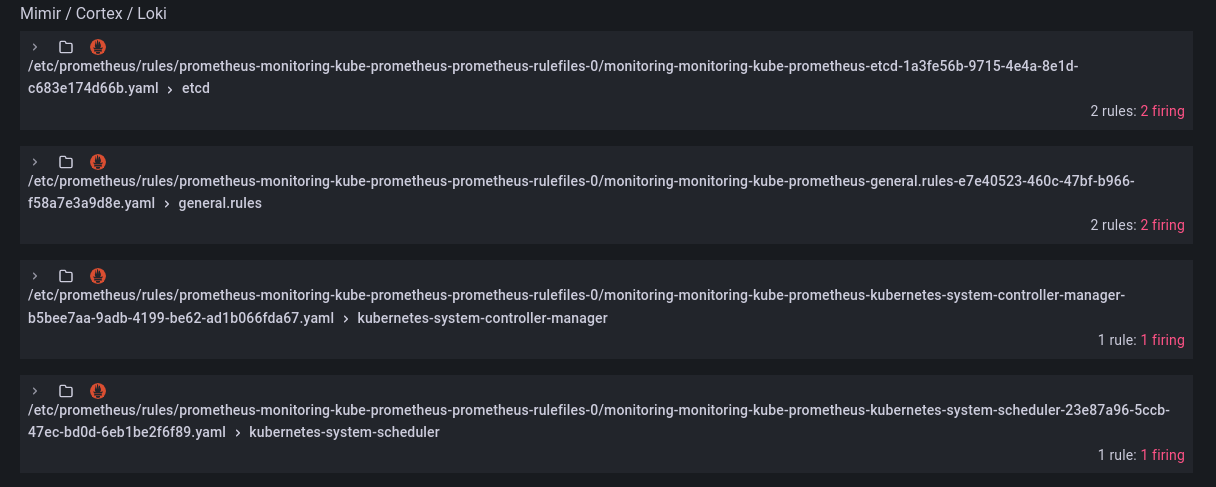
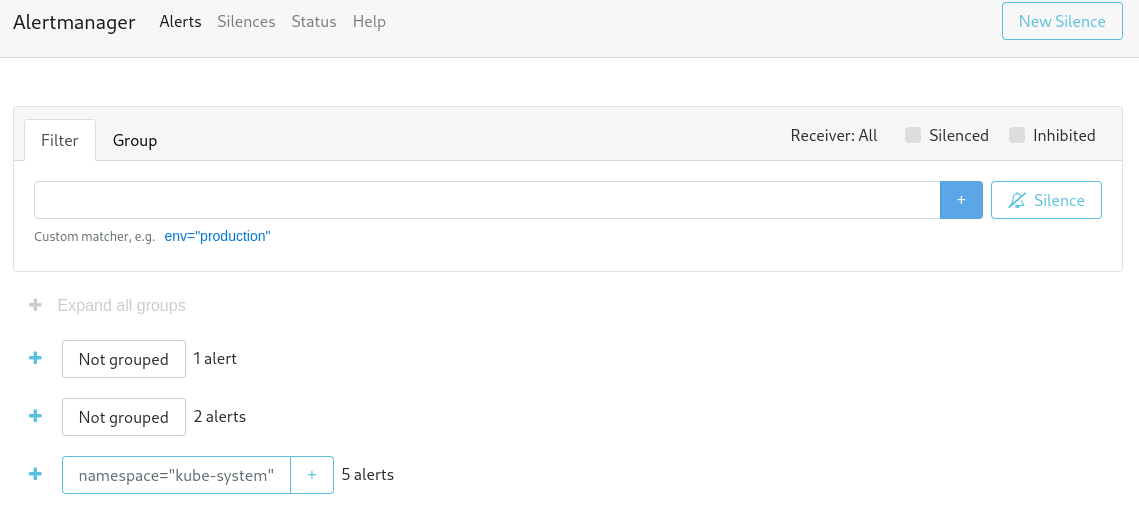
- AlertManager: system to send alerts based on certain rules (e.g., a scraped value for a certain metric exceeded a certain threshold).
-
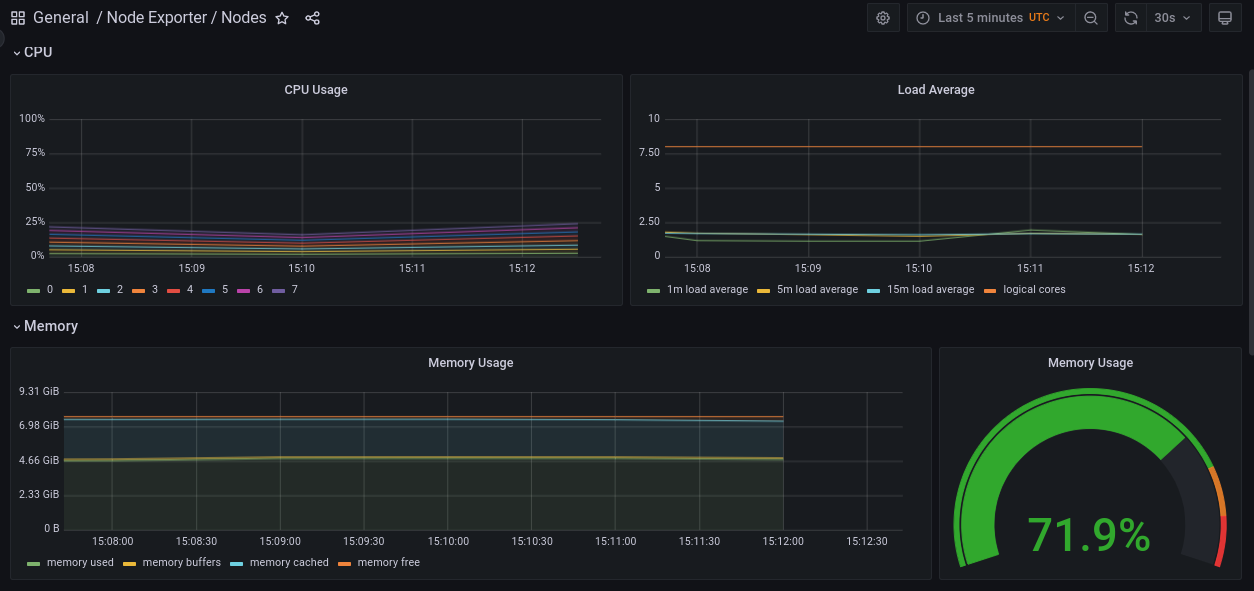
NodeExporter: a daemonset running on all nodes and exporting a
/metricsendpoint for scraping by Prometheus. - Kube-state-metrics: exports metrics about kubernetes itself.
-
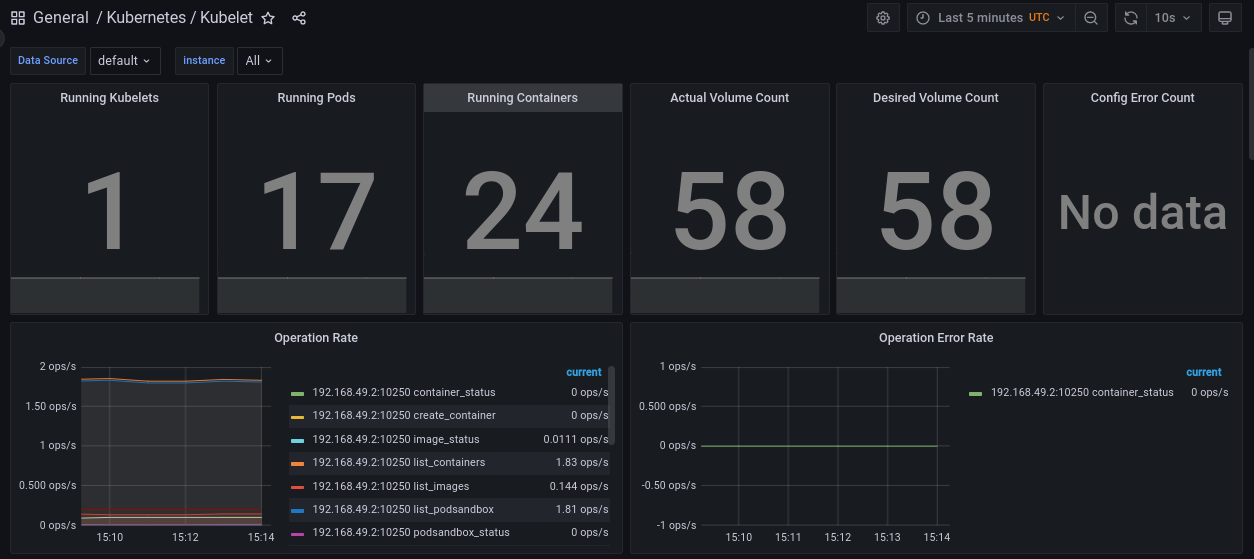
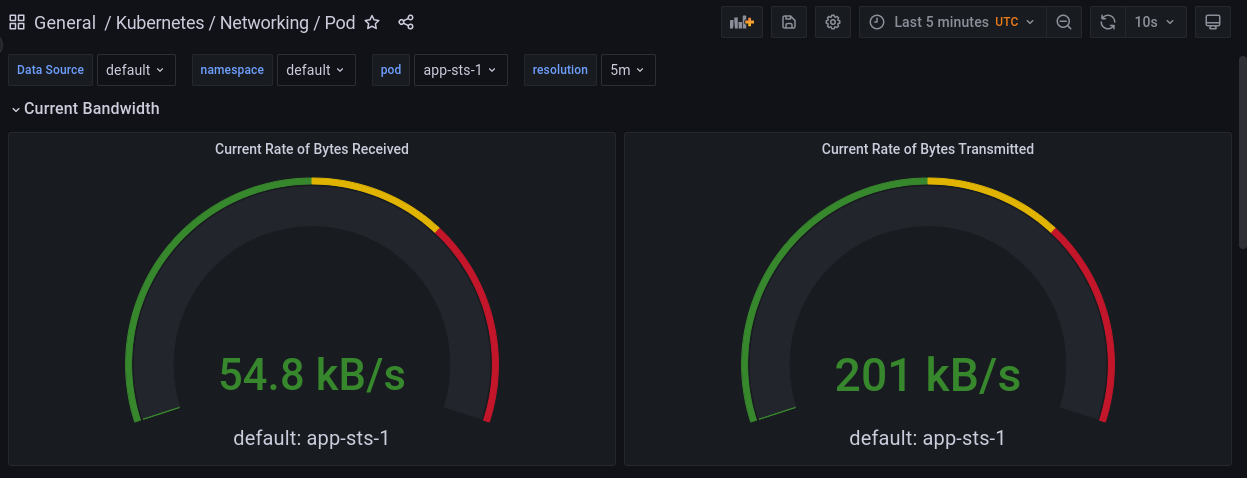
Prometheus Operator: k8s integration/plugin for Protmetheus, allows deploying custom resources (notably,
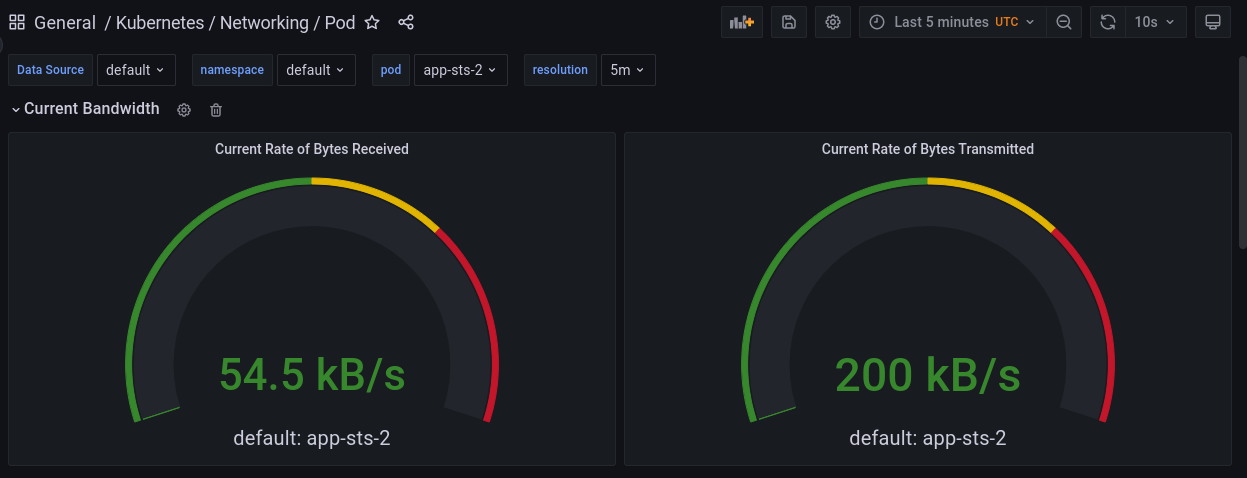
ServiceMonitor,PodMonitor, andPrometheusRule) through CRDs. - Grafana: the visualization web app with pre-created dashboards showing the metrics collected by Prometheus.
# Some of the resources deployed by the chart
$ kubectl get deployment,svc,sts,ds
deployment.apps/monitoring-grafana
deployment.apps/monitoring-kube-prometheus-operator
deployment.apps/monitoring-kube-state-metrics
service/alertmanager-operated
service/monitoring-grafana
service/monitoring-kube-prometheus-alertmanager
service/monitoring-kube-prometheus-operator
service/monitoring-kube-prometheus-prometheus
service/monitoring-kube-state-metrics
service/monitoring-prometheus-node-exporter
service/prometheus-operated
daemonset.apps/monitoring-prometheus-node-exporter
statefulset.apps/alertmanager-monitoring-kube-prometheus-alertmanager
statefulset.apps/prometheus-monitoring-kube-prometheus-prometheus

# Other resources (configmaps, secrets, serviceaccount, crds, ...) are not shown-
For testing with minkube, metrics plugin should be added
minikube addons enable metrics-server -
kubectl port-forward svc/monitoring-grafana 80 -n monitoring -
Access dashboards at http://localhost/dashboards, default creds:
admin:prom-operator