Diagnostics
The same (or different) diagnostics can be specified for use in case management, monitoring of survey outputs and test-and-treat interventions, and the model for neonatal mortality. The description of diagnostic tests (in the <diagnostics> element of the XML) entails specifying parameters that determine both the specificity and sensitivity. If a diagnostic is specified for use in case management, it will be applied to those simulated fevers for which treatment is sought. The model option for non-malaria fevers needs to be activated to ensure correct simulation of treatment of incidental parasitaemia, and tracking of numbers of diagnostic tests.
The <diagnostics> element comprises a list of all the different diagnostic tests used in the simulation, including those used in case management, in the monitoring of survey outputs and in test-and-treat interventions. It has the syntax:
<diagnostics>
IN THIS ORDER:
| ( <diagnostic ... /> )*
</diagnostics>
The different diagnostic tests in the list (each corresponding to a different <diagnostic ... /> sub-element) may represent rapid diagnostic tests (RDTs), polymerase chain reaction (PCR) tests, microscopy, or any other real or hypothetical test.
The syntax for these sub-elements is:
<diagnostic
    name=string
  [ units=("Other" or "Garki" or "Malariatherapy") ]
  >
IN THIS ORDER:
| EXACTLY ONE OF:
| |   <deterministic ... />
| |   <stochastic ... />
</diagnostic>
where the name of the diagnostic is a string that is used to refer to it elsewhere in the XML (i.e. in the clinical decision tree, the specification of monitoring options, and/or in test-and-treat interventions). A diagnostic is also used in the context of neonatal mortality, where the probability of death depends on the prevalence in the population of child-bearing age. The neonatal model was parameterized to use 'Other' with a minDensity of 40 parasites/ul. The diagnostic does need to be mentioned in every scenario where it is used. Alternatively, it can use another diagnostic among those listed in the scenario's diagnostics section, or it can be omitted (then it uses the monitoring diagnostic).
The parasite density units refers to the methodology used to determine densities (for comparison with the nominal cut-off density of the diagnostic). This may take values: "Other","Garki", or "Malariatherapy". Parasite densities, as estimated according to standard microscopy methods (counting against 200 leucocytes), the Garki method(counting the proportion of microscopy fields positive for parasites), and as derived from Malariatherapy data(counting the number of parasites seen in a large number of microscopy fields) are not equivalent. Internally, a "bias" factor is used to convert values estimated by one methods to values comparable with another (see AJTMHv75 supplement 2 pp20-21). If the is option not specified, "Other" is assumed, unless the GARKI_DENSITY_BIAS model option is used, in which case "Garki" must be specified.
Each diagnostic must be specified as either deterministic or stochastic. A deterministic test is associated with a minimum density: if the simulated density (with bias correction as appropriate) is at least this density then the test counts as positive:
<deterministic
    minDensity=double
  />
The units are parasites/microlitre. If a value of 0 is specified then the test outcome is always positive.
Tests with stochastic outcomes are specified as follows:
<stochastic
    dens_50=double
    specificity=double
  />
dens_50 is again in parasites/microlitre, while the specificity is a proportion.
This formulation allows specification of both false positive and false negative rates. The probability of a positive outcome is modelled as 1 + s×(x/(x+d) - 1) where x is the parasite density, d is the density at which the test outcome has a 50% chance of being positive, and s is the probability of a positive outcome given no parasites (the specificity). (Note that parasite density outputs should not be used if the specificity is assigned a value < 1 as this can lead to missing values).
In general, the performance of diagnostic tests depends on the parasite density of the individual being tested(http://www.wpro.who.int/sites/rdt/whatis/action.htm, Kilian et al, 2000). To model this, we looked for a function to relate parasite densities to the probability of a positive outcome.
Source data We used the data in Table 4 in Murray et al, 2008 to model the outcome of RDTs for Plasmodium falciparum. This table shows the percent sensitivity (and the 95% confidence interval) found for the RDT BinaxNOW Malaria in a rigorous field trial, at different levels of parasitaemia. This assay is based on detection of the antigens HRP-2 for P. falciparum and aldolase for generic Plasmodium. We associate the sensitivities listed for P. falciparum with the mid-points of the parasite density ranges listed, and one minus the specificity for a density of 0 parasites.
A proposal for the operating characteristics of microscopy is shown in Table 1. This is sourced from expert opinion (personal communication, A. Schapira), backed by the observation that microscopy diagnostic errors are noted more commonly for low-density parasitemias of 10 to 100 parasites/µL(Kilian et al, 2000).
Table 1:
| parasites / µL | sensitivity (P. falciparum) |
|---|---|
| >100 | 90% |
| 0-100 | 75% |
| Specificity | 75% |
Model A sigmoidal function is a good match for this data. Note that since the probability of obtaining a positive outcome when testing a sample with no parasites is non-zero, we need to scale the sigmoidal. With a parasite density of Y, probability of a positive outcome with zero parasites α, and parameter β, this gives us the probability of a positive test outcome as a function of parasite density:
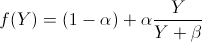
and thus the diagnostic test’s output can be modeled as Bernoulli (f(Y)).
Parameters We use the parameters in the following table to model RDT and microscopy diagnostics.
| Parameter | Description | RDT | Microscopy |
|---|
| α | specificity | 0.942 | 0.75 |
|---|---|---|---|
| β | density at which sensitivity is half given α=1 | 50 |
Evaluation For the Plasmodium falciparum data, plotting our predictions for the probability of a positive outcome by RDT against the source data shows that our model predictions are in good agreement with the source on which they are based.

Most rapid diagnostic tests for malaria depend on detection of the HRP2 molecule. Deletions of the HRP2 gene result in parasites becoming undetectable in these tests. Since [unreleased version], OpenMalaria diagnostics may be affected by HRP2 deletions (PR #248). By default, diagnostics are unaffected by HRP2 deletions; to model this:
(1) The diagnostic(s) used for case management and/or MSAT should include mechanism="HRP2" as follows:
    <diagnostic name="RDT" mechanism="HRP2">
      <stochastic dens_50="50" specificity=".942"/>
    </diagnostic>
Note that the diagnostic used for monitoring cannot be HRP2-dependent.
(2) A HRP2-deficient allele must be added to the simulation via a parasiteGenetics element. samplingMode may be initial or tracking; see the section on drug resistance for more information (noting that parasite genetics modeling may be enabled for both 5- and 1-day models, while drug modeling is limited to 1-day models).
  <parasiteGenetics samplingMode="tracking">
    <locus name="hrp2">
      <allele name="wildtype" initialFrequency="0.5" fitness="1"/>
      <allele name="hrp2_deficient" initialFrequency="0.5" fitness="1" hrp2_deletion="true"/>
    </locus>
  </parasiteGenetics>
| Download openmalaria | Installation instructions | XML Schema Documentation |
| XML Schema Version | Program version | master |
develop |
|---|---|---|---|
| 43 | schema-43.0 |
 |
 |