high system cpu usage on c6gn instances with high throughput loads #195
Comments
|
|

|
Hi @romange, Thanks for reporting this.
Thanks, |
|
Hi Arthur, thanks for responding so quickly. Replying to each question.
Attaching
|


|
@romange it is possible that you are running into this issue: #159. One way to confirm would be to run the same test on a c6gn vs a c6g (or a c5n) and compare the output of With high-throughput benchmarks, interrupt moderation can have a big impact, even for request/response workloads, because the coalescing happens across multiple connections. It prevents all incoming packets from triggering an interrupt for x microseconds and then handles a group of them all at once. It led to a 14% performance improvement in my high-throughput HTTP benchmark: https://talawah.io/blog/extreme-http-performance-tuning-one-point-two-million/#interrupt-moderation. |
|
I will check. Thanks Mark! |
|
Following @talawahtech suggestion, I run the test again today in us-east-2.
|

|
@romange |
|
nothing. same image, same vm. the only thing I did differently is choosing us-east-2. |
|
@romange based on that image it looks like you are only doing around 1800 request/packets per second. At that request rate you won't see much softirq activity. Also, the irq numbers in dstat command that I gave you are wrong for the c6gn. I believe the irq numbers for the individual network queues are in the 40+ range for the c6gn vs the 20+ range for the c5n. You can run |
|
I consistently sent around 2M qps to that instance. I took the subset of
network irqs - they start from 21 and there are 32 irq queues on 8xlarge.
My network device on ubuntu is called ens5.
…On Thu, Dec 30, 2021 at 8:41 PM Marc Richards ***@***.***> wrote:
@romange <https://github.com/romange> based on that image it looks like
you are only doing around 1800 request/packets per second. At that request
rate you won't see much softirq activity.
Also, the irq numbers in dstat command that I gave you are wrong for the
c6gn. I believe the irq numbers for the individual network queues are in
the 40+ range for the c6gn vs the 20+ range for the c5n. You can run cat
/proc/interrupts | grep eth0 to confirm and use the numbers from that
output in the dstat command to see the per queue interrupt data.
—
Reply to this email directly, view it on GitHub
<#195 (comment)>,
or unsubscribe
<https://github.com/notifications/unsubscribe-auth/AA4BFCB6UGJOWIOFQPE2S3LUTSRVVANCNFSM5JJF56AA>
.
Triage notifications on the go with GitHub Mobile for iOS
<https://apps.apple.com/app/apple-store/id1477376905?ct=notification-email&mt=8&pt=524675>
or Android
<https://play.google.com/store/apps/details?id=com.github.android&referrer=utm_campaign%3Dnotification-email%26utm_medium%3Demail%26utm_source%3Dgithub>.
You are receiving this because you were mentioned.Message ID:
***@***.***>
--
Best regards,
Roman
|
|
It seems that the problem has been fixed |
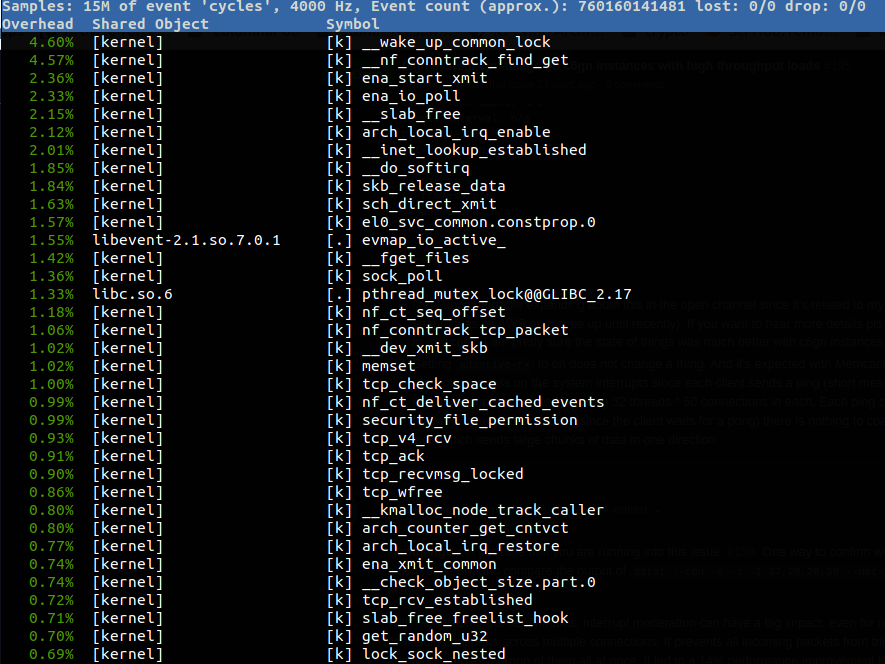
when running memcached loadtest on c6gn.16xlarge I noticed that soft irq takes lots of CPU. As far as I remember it has not been before and looks like degradation in hypervisor, maybe?
I checked it with ubuntu 21.04 and 21.10, with both native ENA driver that comes with the distibution and with 2.6. It's always the same thing.
To reproduce (using 2 c6gn.16xlarge):
/usr/bin/memcached -t 32 -m 640 -p 11211 -u memcache -l 0.0.0.0 -c 10240on server side.memtier_benchmark -s <private_ip> -p 11211 --ratio 0:1 -t 32 -c 50 -n 2000000 -P memcache_texton the load test instance.The text was updated successfully, but these errors were encountered: