| title | description | date | slug | heroImagePath | tags | ||||||
|---|---|---|---|---|---|---|---|---|---|---|---|
The Airflow UI |
A high-level overview of the Airflow UI |
2018-05-21 00:00:00 UTC |
airflow-ui |
|
A notable feature of Apache Airflow is the UI, which provides insights into your DAGs and DAG runs. The UI is a useful tool for understanding, monitoring, and troubleshooting your pipelines.
In this guide, we'll walk through an overview of some of the most useful features and visualizations in the Airflow UI. Each section of the guide corresponds to one of the tabs at the top of the Airflow UI. If you're not already using Airflow and want to get it up and running to follow along, check out the Astro CLI to quickly run Airflow on your local machine.
Note: This guide focuses on the Airflow 2 UI, which was significantly redesigned compared to previous Airflow versions. If you haven't upgraded yet, check out the Airflow documentation on upgrading from 1.10 to 2.
To get the most out of this guide, you should have knowledge of:
- What Airflow is and when to use it. See Introduction to Apache Airflow.
- Airflow DAGs. See Introduction to Airflow DAGs.
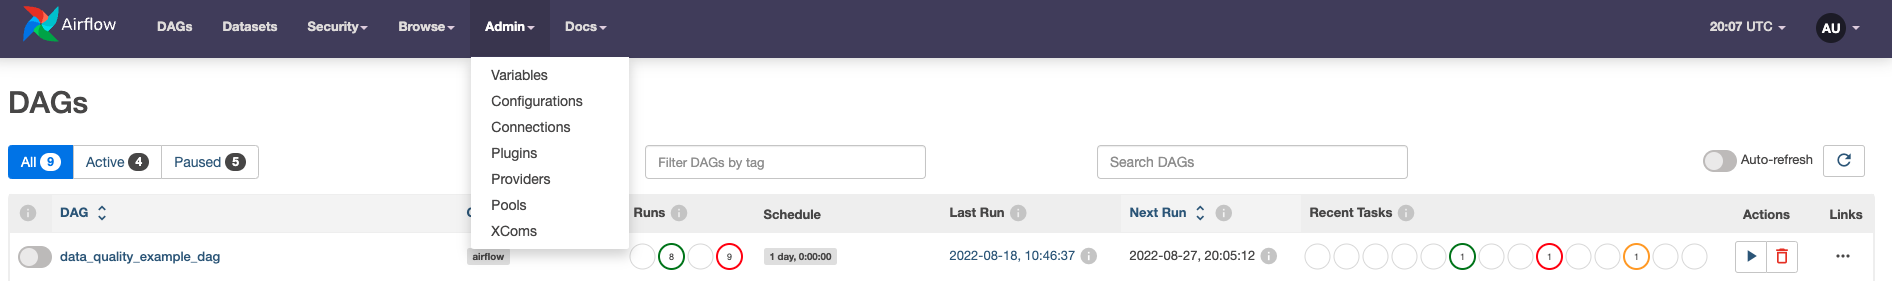
The DAGs view is the landing page when you sign in to Airflow. It shows a list of all your DAGs, the status of recent DAG runs and tasks, the time of the last DAG run, and basic metadata about the DAG like the owner and the schedule. You can toggle the Auto-refresh button (added in Airflow 2.4) to on to see the status of the DAGs update in real time.
Note: All screenshots in this guide were taken from an Astronomer Runtime Airflow image. Other than some modified colors and in some screenshots an additional
Astronomertab, the UI is the same as that of OSS Airflow.
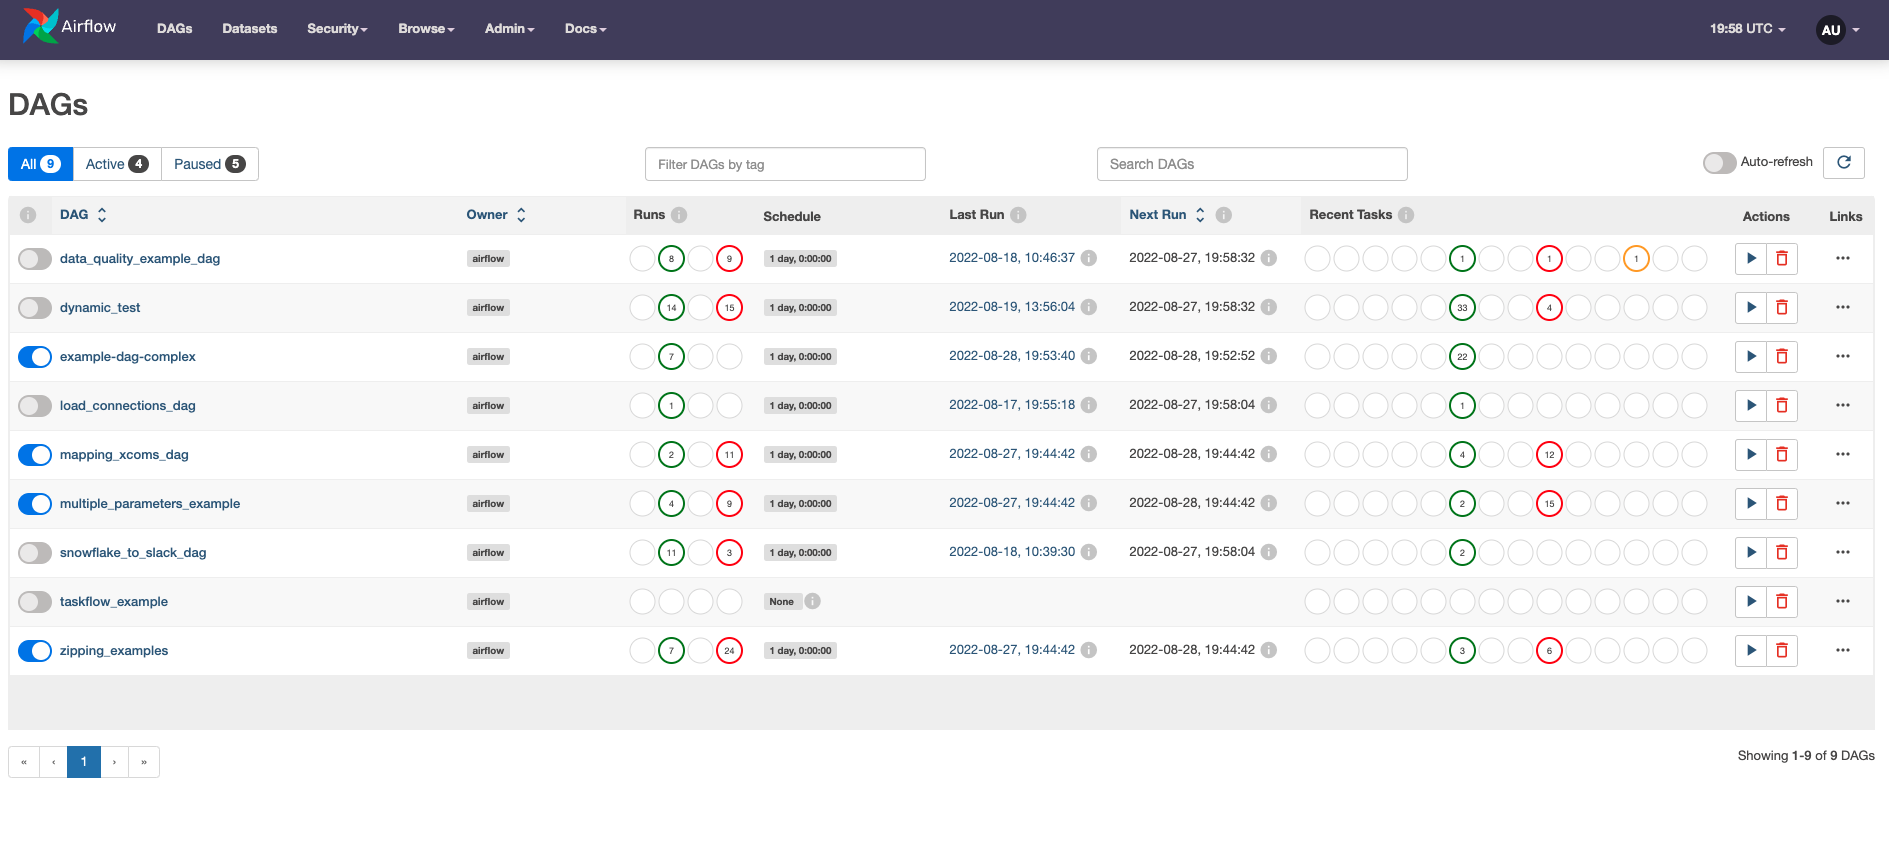
From the DAGs view you can:
- Pause/unpause a DAG with the toggle to the left of the DAG name.
- Filter the list of DAGs to show active, paused, or all DAGs.
- Trigger, refresh, or delete a DAG with the buttons in the Actions section.
- Navigate quickly to other DAG-specific pages from the Links section.
To drill down on a specific DAG, you can click on its name or use one of the links. This will give you access to the views described in the following sections.
The Graph View shows a visualization of the tasks and dependencies in your DAG and their current status for a specific DAG run. This view is particularly useful when reviewing and developing a DAG. When running the DAG, you can toggle the Auto-refresh button to on to see the status of the tasks update in real time.
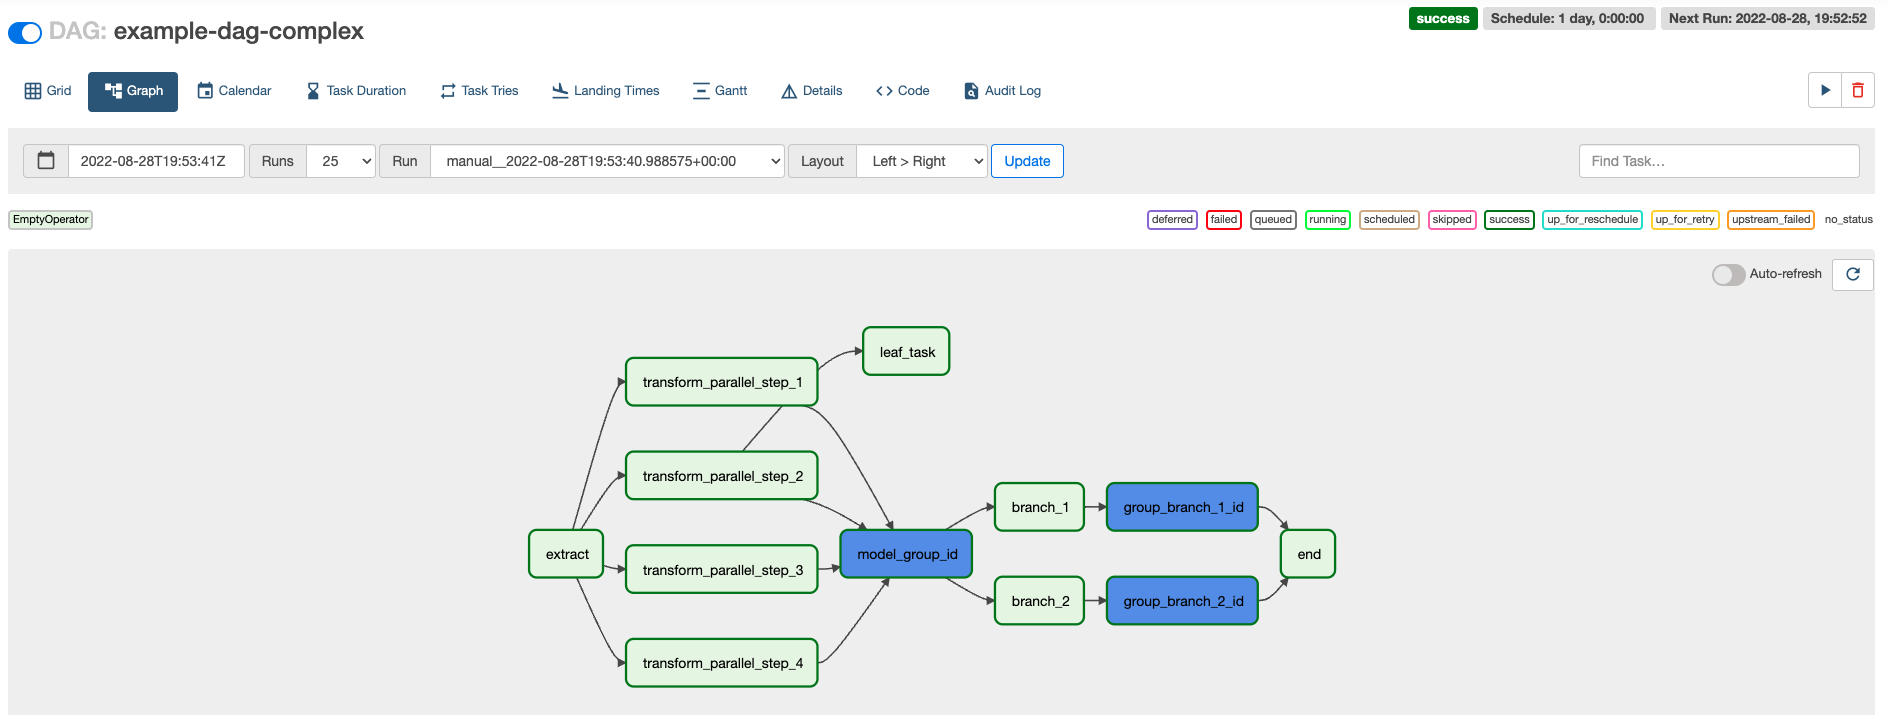
Clicking on a specific task in the graph will give you links to additional views and actions you can take on that task instance.
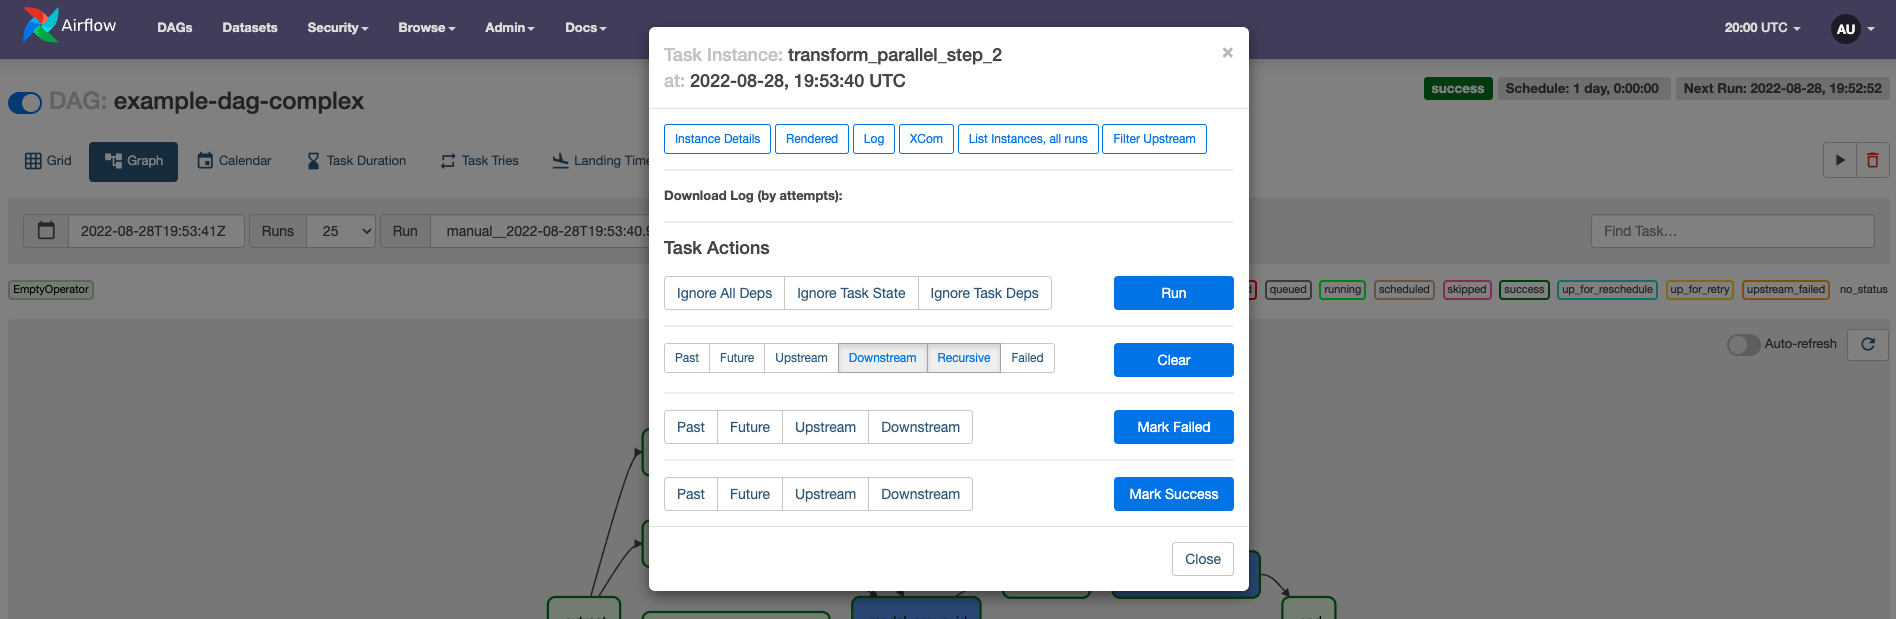
Specifically, the additional views available are:
- Instance Details: Shows the fully rendered task - an exact summary of what the task does (attributes, values, templates, etc.).
- Rendered: Shows the task's metadata after it has been templated.
- Log: Shows the logs of that particular
TaskInstance. - XCom: Shows XComs created by that particular
TaskInstance. - List Instances, all runs: Shows a historical view of task instances and statuses for that particular task.
- Filter Upstream: Updates the Graph View to show only the task selected and any upstream tasks.
The actions available for the task instance are:
- Run: Manually runs a specific task in the DAG. You have the ability to ignore dependencies and the current task state when you do this.
- Clear: Removes that task instance from the metadata database. This is one way of manually re-running a task (and any downstream tasks, if you choose). You can choose to also clear upstream or downstream tasks in the same DAG, or past or future task instances of that task.
- Mark Failed: Changes the task's status to failed. This will update the metadata database and stop downstream tasks from running if that is how you have defined dependencies in your DAG. You have additional capabilities for marking past and future task instances as failed and for marking upstream or downstream tasks as failed at the same time.
- Mark Success: Changes the task's status to success. This will update the metadata database and allow downstream tasks to run if that is how you have defined dependencies in your DAG. You have additional capabilities for marking past and future task instances as successful and for marking upstream or downstream tasks as successful at the same time.
The Grid View was introduced in Airflow 2.3 and shows a grid representation of the DAG's previous runs, including their duration and the outcome of all individual task instances. Each column represents a DAG run and each square represents a task instance in that DAG run. Task instances are color-coded according to their status. A small play icon on a DAG run indicates that a run was triggered manually, and a small dataset icon shows that a run was triggered via a dataset update.
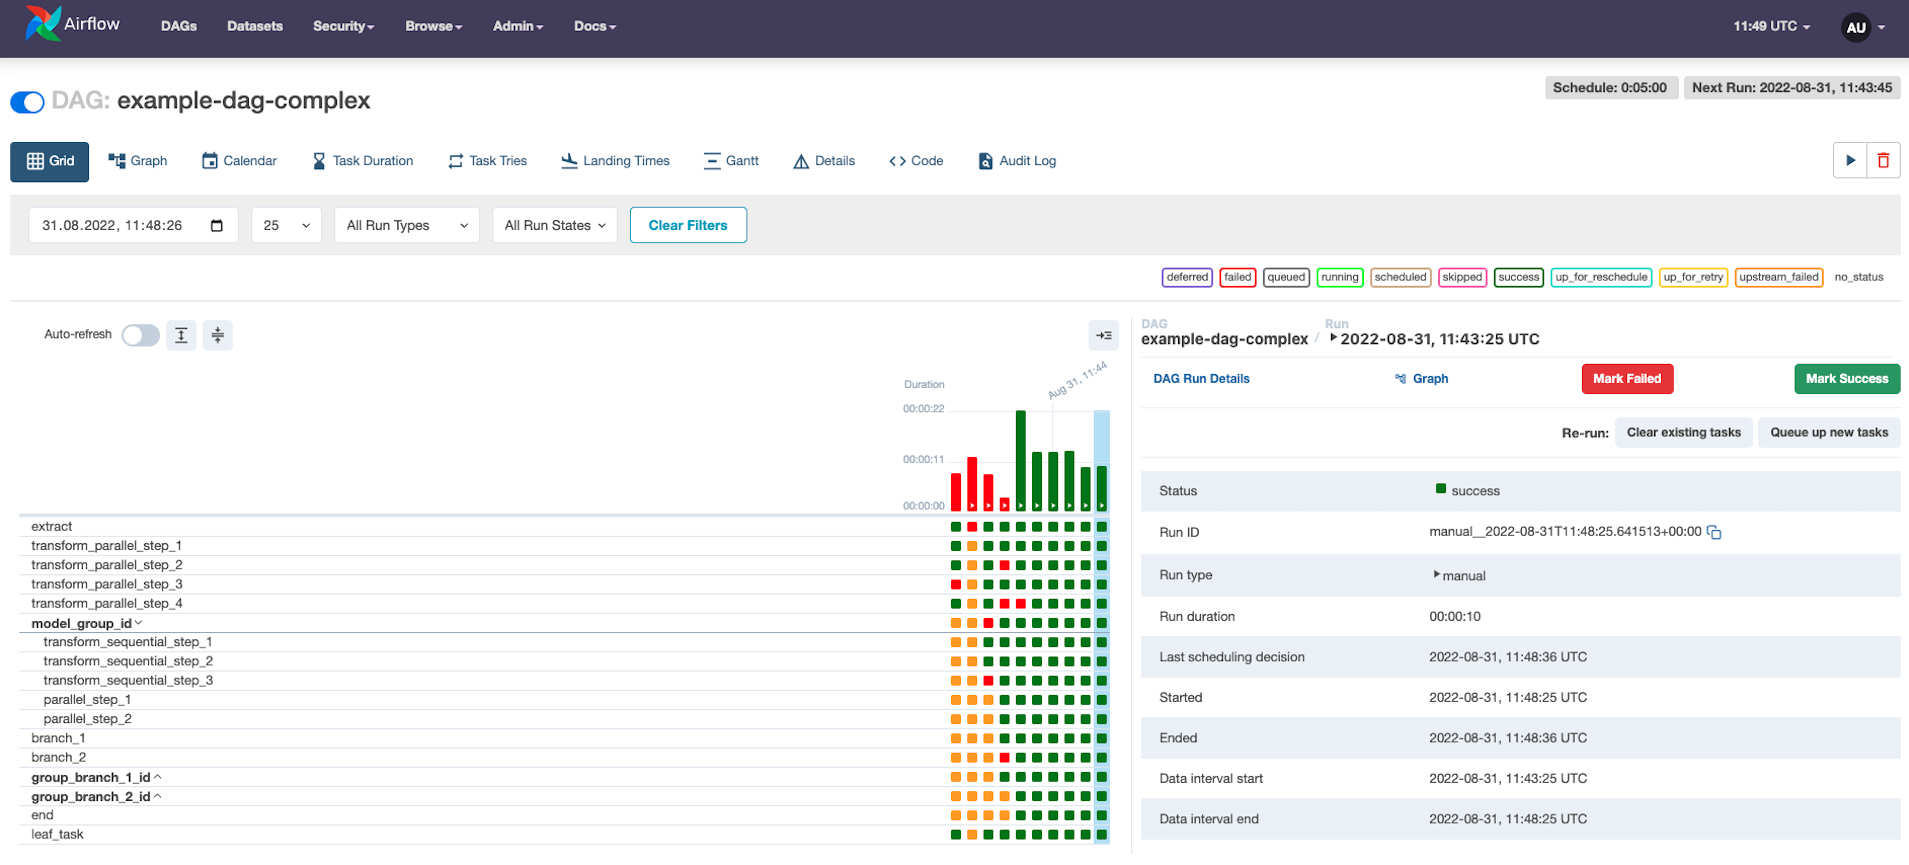
Clicking on a square in the grid will open a view with more details about that individual task instance as well as links to the same additional views and actions described in the Graph View section above.
Note: The Grid View replaced the Tree View in Airflow version 2.3+.
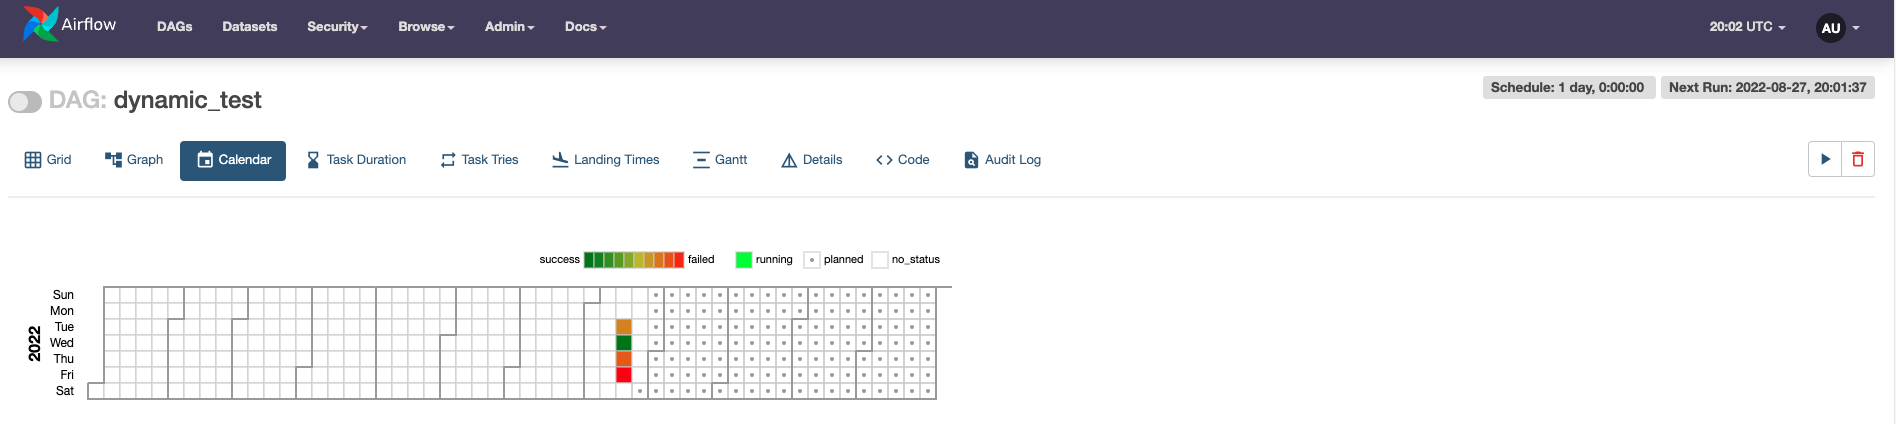
The Calendar View is new as of Airflow 2.1. It shows the state of DAG runs overlaid on a calendar. States are represented by color. If there were multiple DAG runs on the same day that had different states (e.g. one failed, one succeeded), the color will be a gradient between green (success) and red (failed).
The Code View shows the code that is used to generate the DAG. While your code should live in source control, the Code View can be a useful way of gaining quick insight into what is going on in the DAG. Note that code for the DAG cannot be edited directly in the UI.
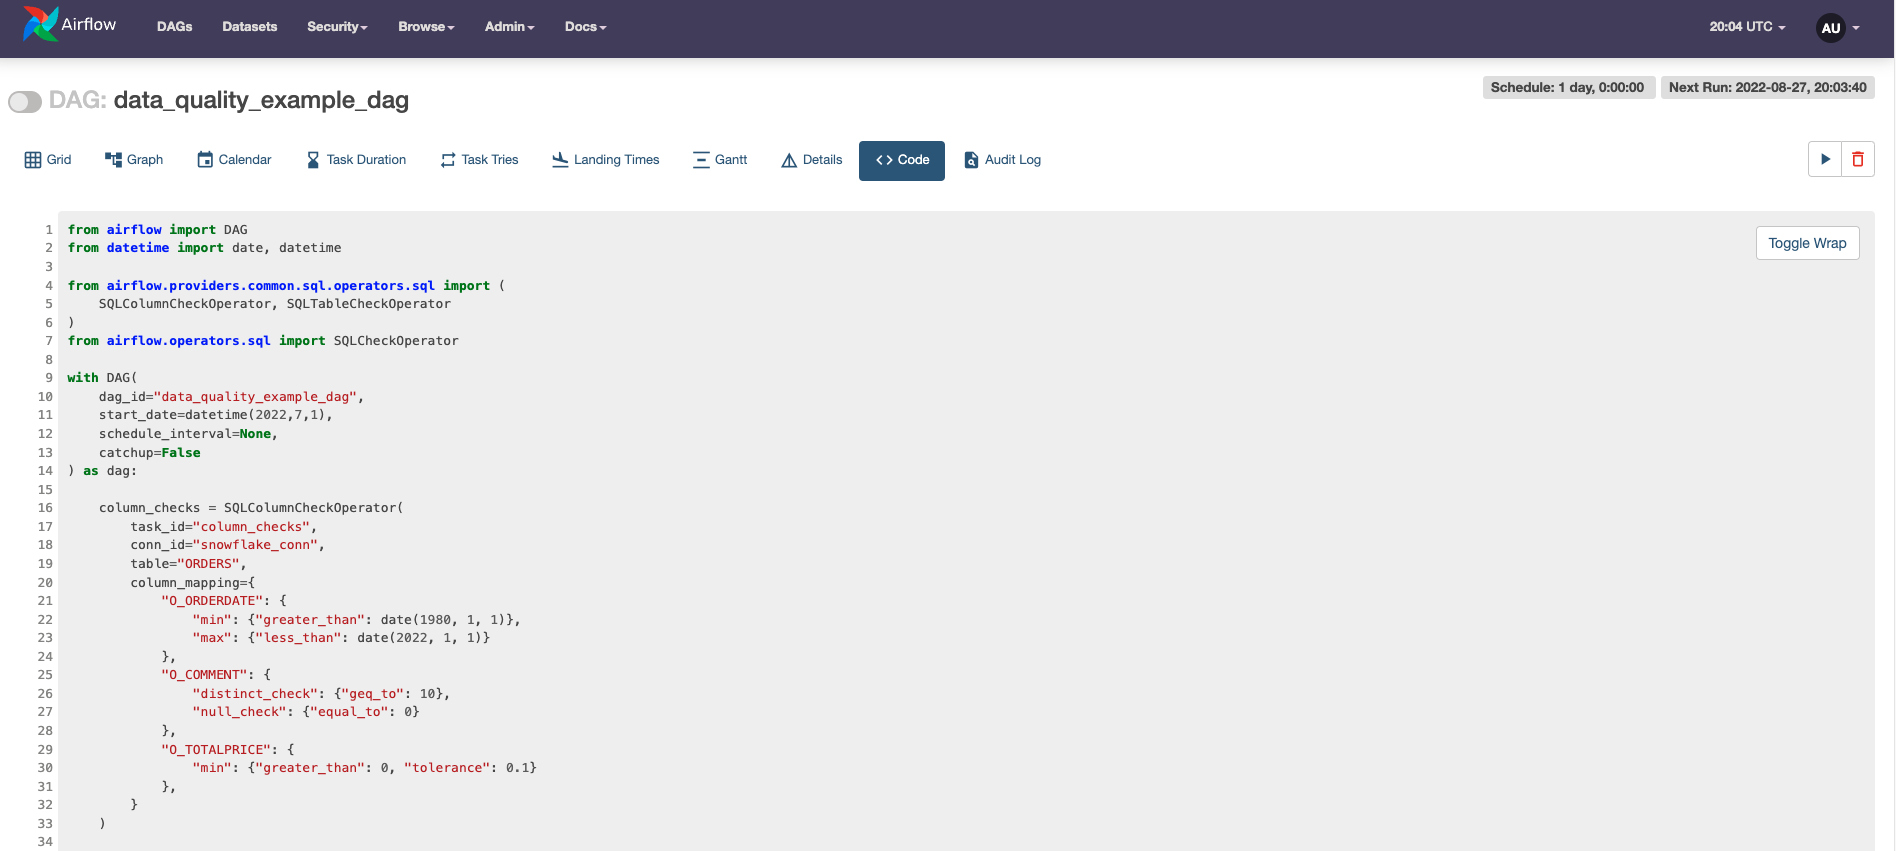
Also of note: This view shows code only from the file that generated the DAG. It does not show any code that may be imported in the DAG, such as custom hooks or operators or code in your /include directory.
There are a couple of additional DAG views that we won't cover in depth here, but are still good to be aware of:
- Task Duration: Shows a line graph of the duration of each task over time.
- Task Tries: Shows a line graph of the number of tries for each task in a DAG run over time.
- Landing Times: Shows a line graph of the time of day each task started over time.
- Gantt: Shows a Gantt chart with the duration of each task for the chosen DAG run.
- Details: Shows details of the DAG configuration and DagModel debug information.
- Audit Log: Shows selected events for all DAG runs.
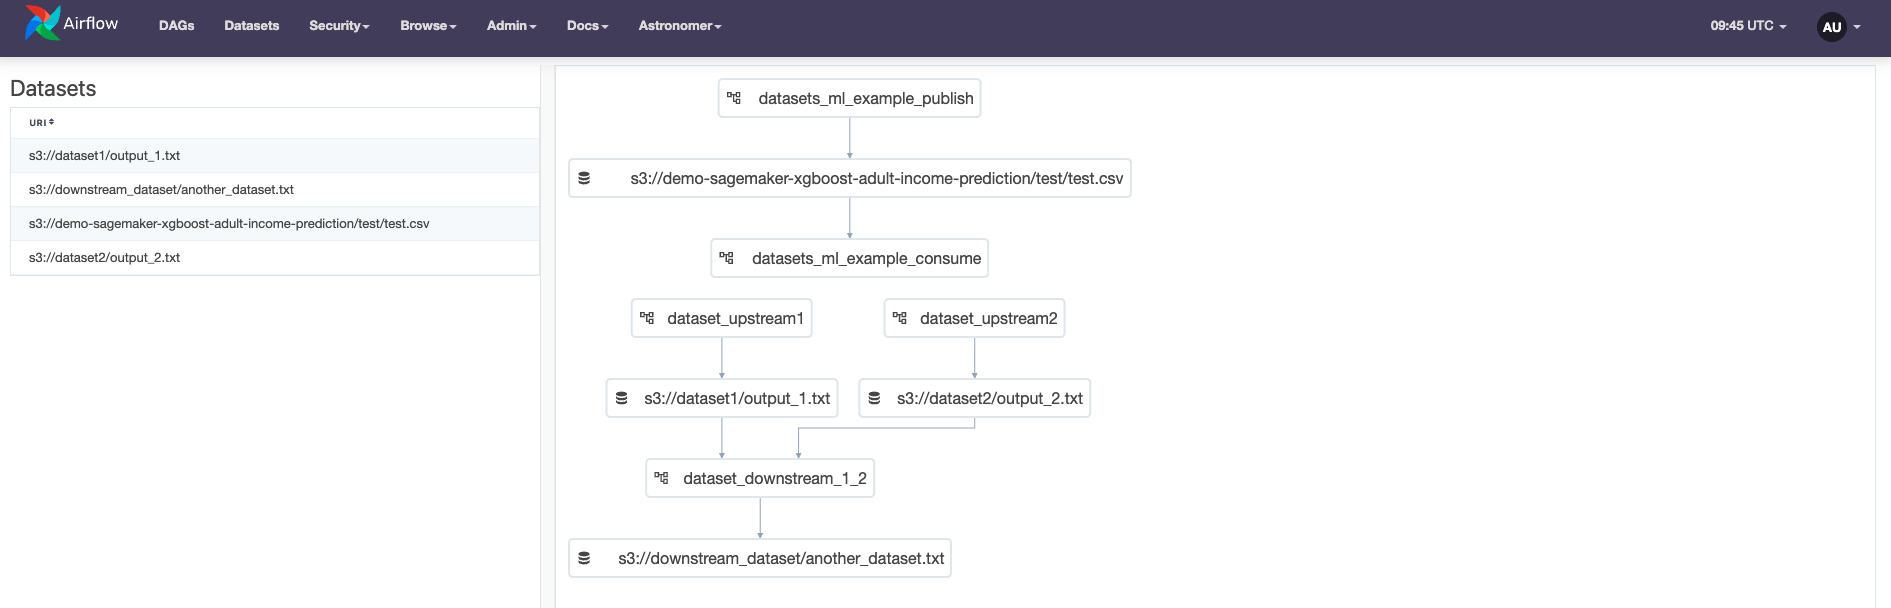
The Dataset tab was introduced in Airflow 2.4 in support of the new dataset driven scheduling feature. The Dataset tab links to a page showing all datasets that have been produced in this Airflow environment, as well as all dependencies between datasets and DAGs in a graph.
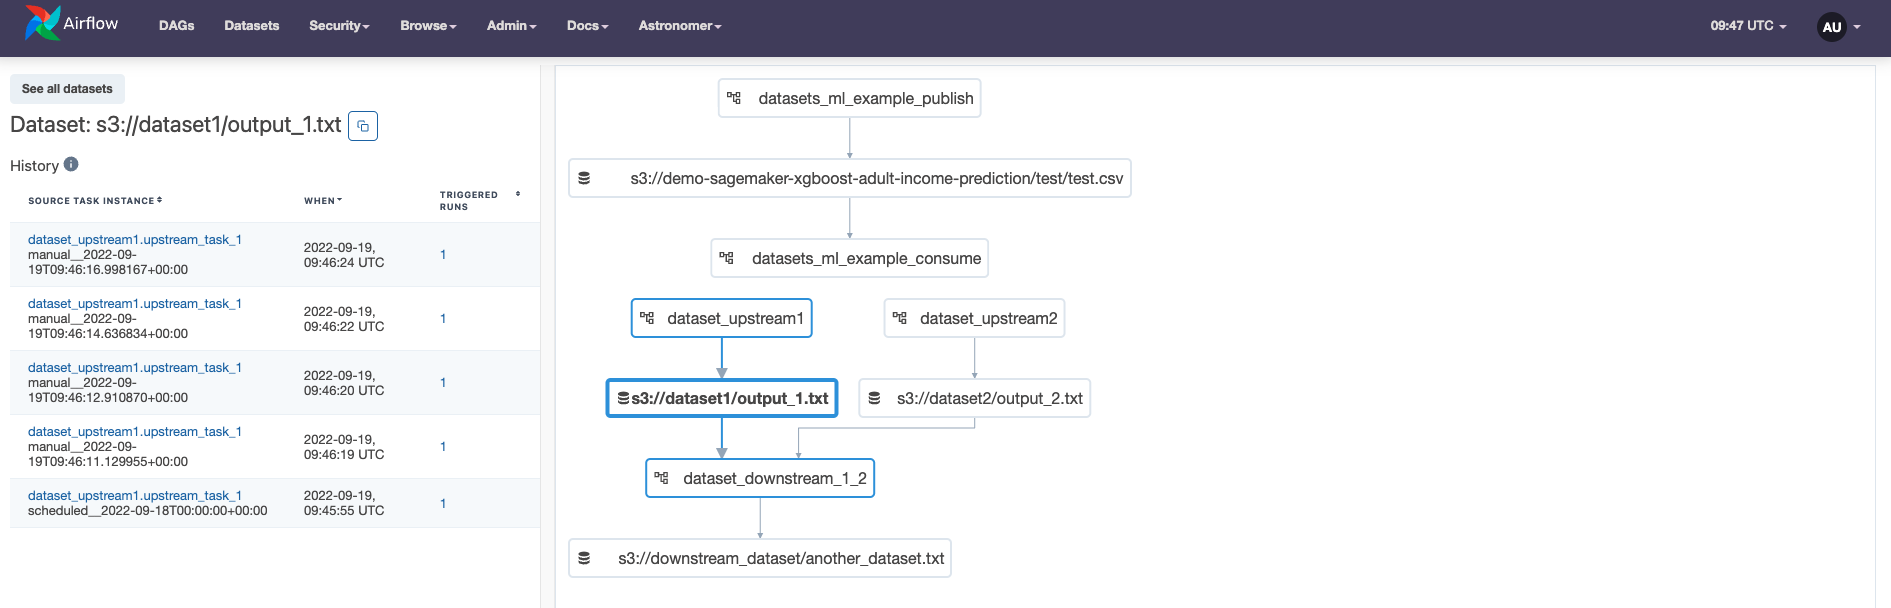
Clicking on any individual Dataset will open the history of all updates to this Dataset that were recorded in this Airflow environment.
The Security tab links to multiple pages, including List Users and List Roles, that can be used to review and manage Airflow RBAC. For more information on working with RBAC, check out the Airflow documentation.
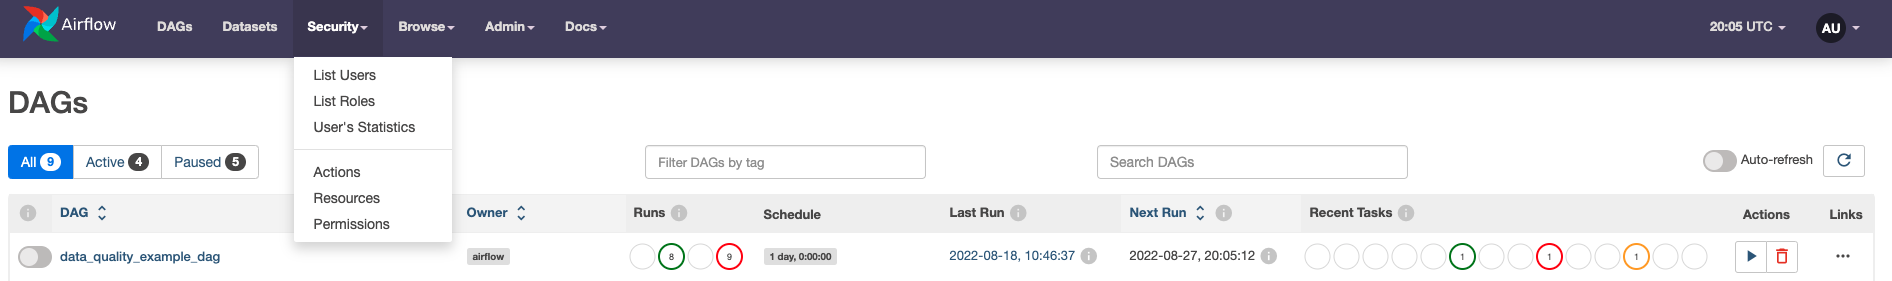
Note that if you are running Airflow on Astronomer, the Astronomer RBAC will extend into Airflow and take precedence (i.e. there is no need for you to use Airflow RBAC in addition to Astronomer RBAC). Astronomer RBAC can be managed from the Astronomer UI, so the Security tab may be less relevant for Astronomer users.
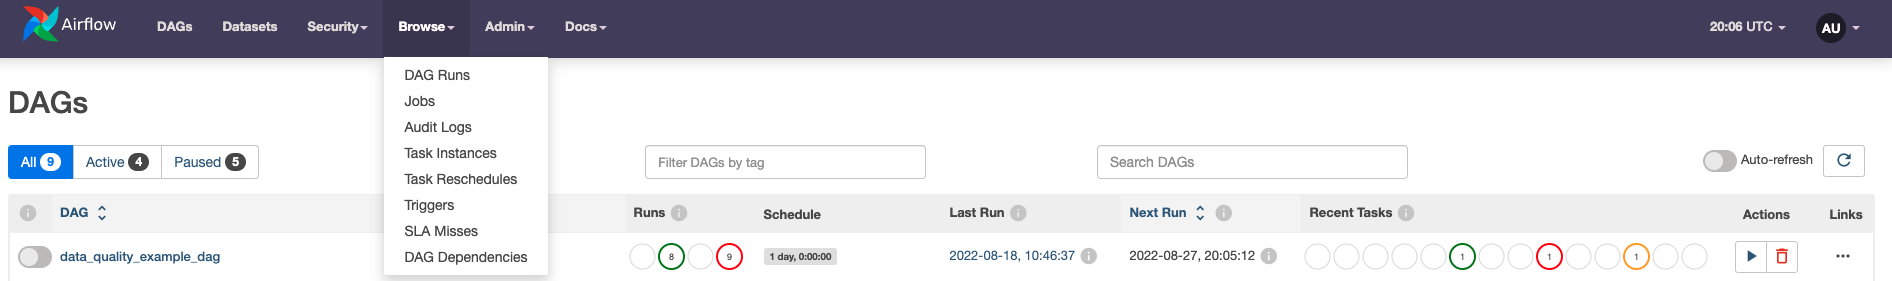
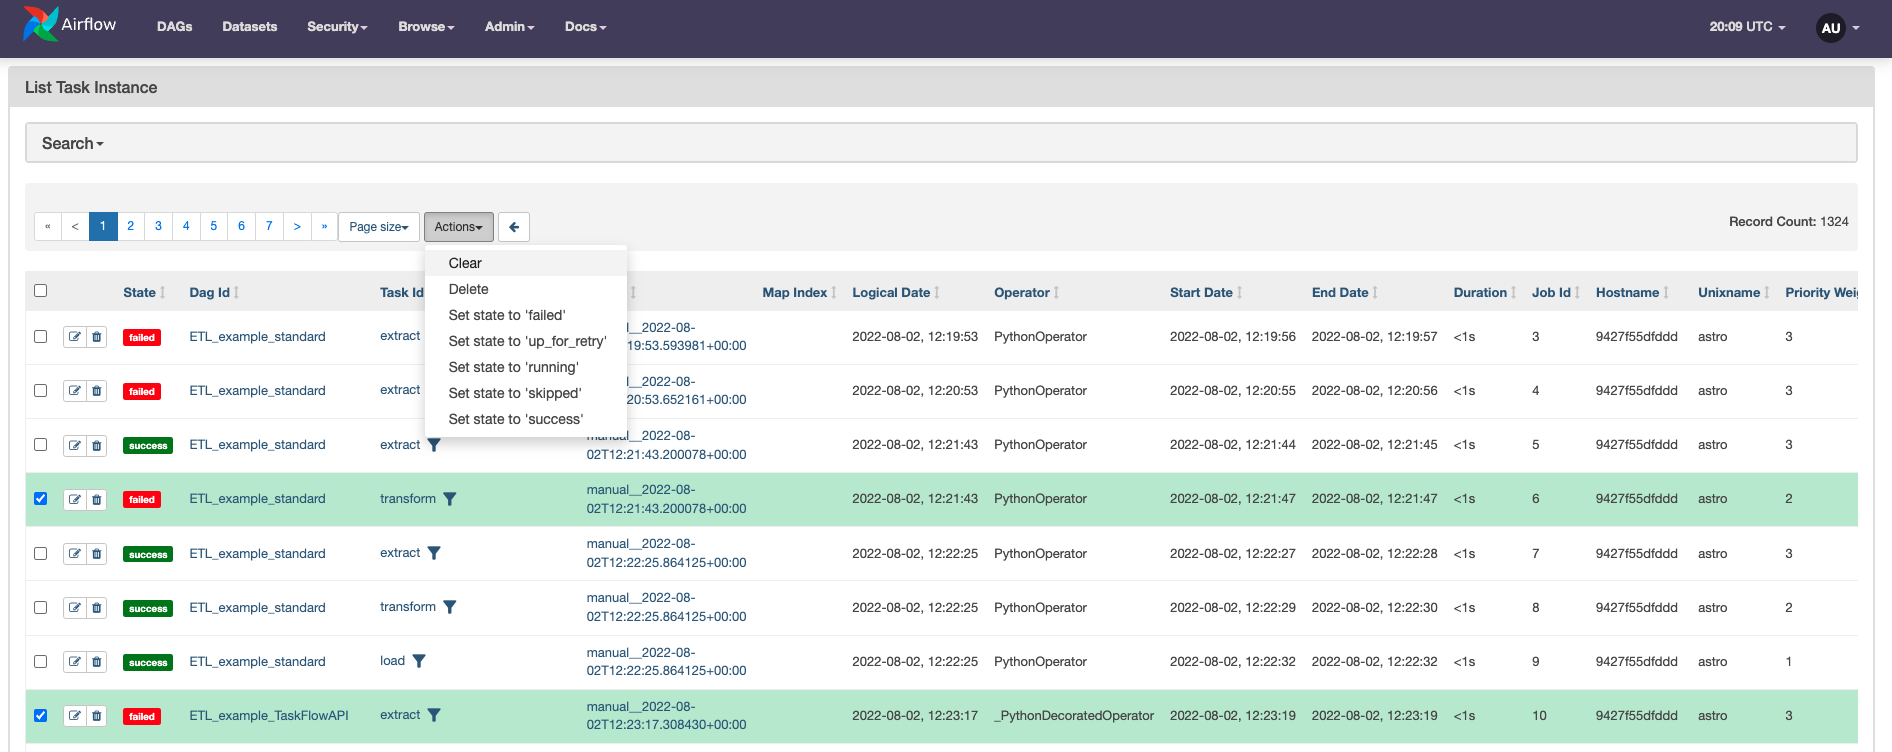
The Browse tab links to multiple pages that provide additional insight into and control over your DAG runs and task instances for all DAGs in one place.
The DAG runs and task instances pages (shown in the screenshot below) are the easiest way to view and manipulate these objects in aggregate. If you need to re-run tasks in multiple DAG runs, you can do so from this page by selecting all relevant tasks and clearing their status.
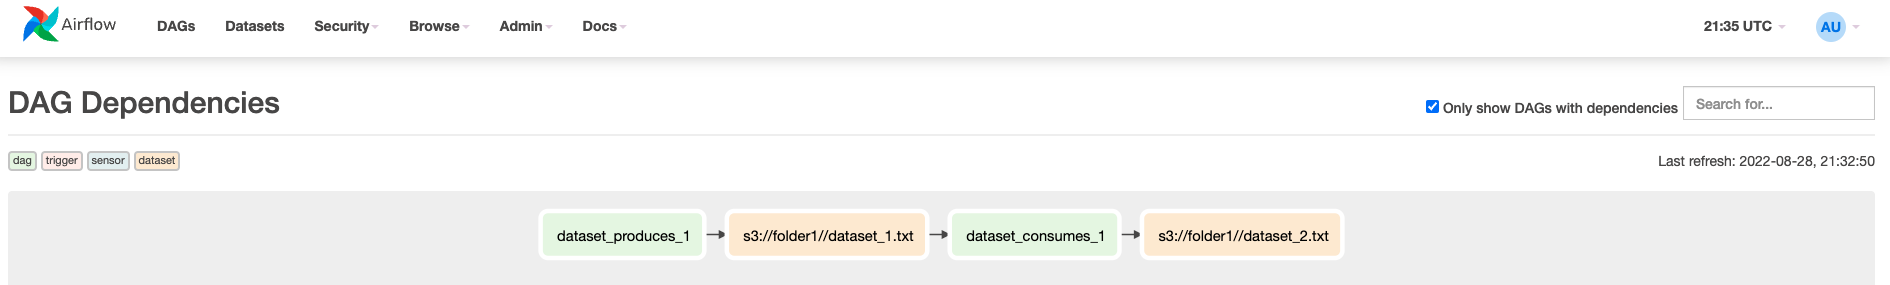
The DAG Dependencies view shows a graphical representation of any cross-DAG and dataset dependencies in your Airflow environment.
Other views in the Browse tab include:
- Jobs: Shows a list of all jobs that have been completed. This includes executed tasks as well as scheduler jobs.
- Audit Logs: Shows a list of events that have occurred in your Airflow environment that can be used for auditing purposes.
- Task Reschedules: Shows a list of all tasks that have been rescheduled.
- Triggers: Shows any triggers that occurred in this Airflow environment. To learn more about triggers and related concepts added in Airflow 2.2, you can check out the guide on Deferrable Operators.
- SLA Misses: Shows any task instances that have missed their SLAs.
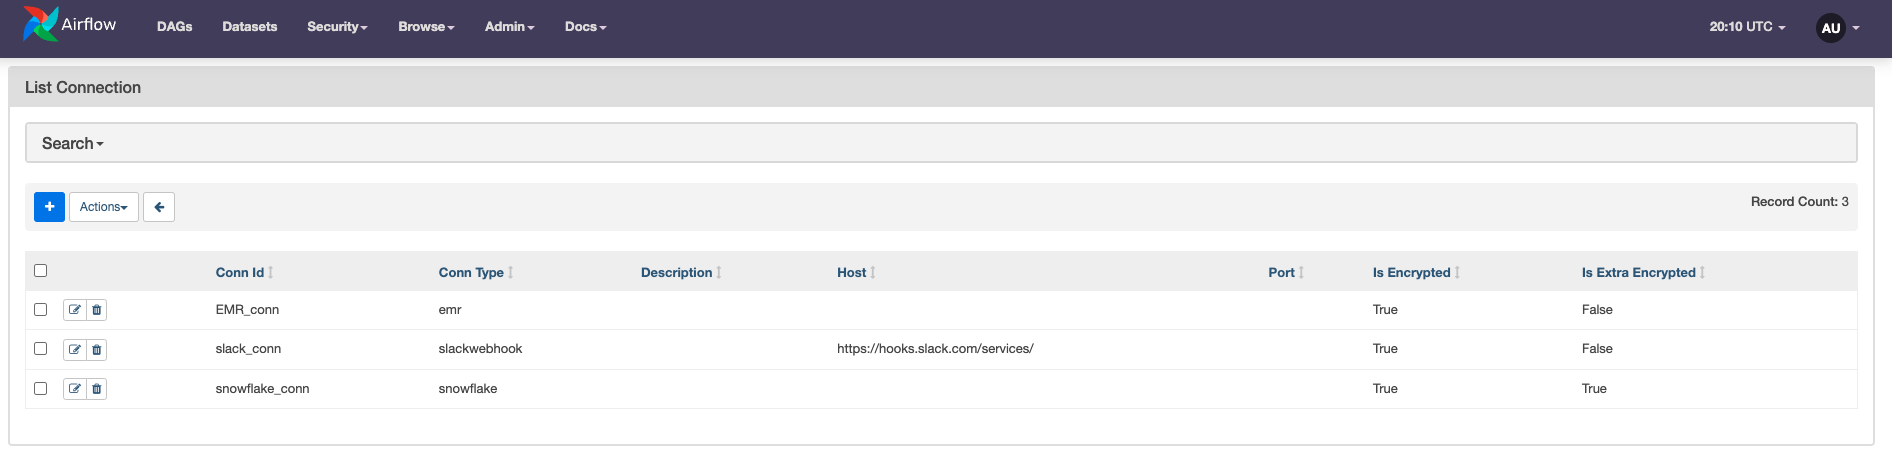
The Admin tab links to pages for content related to Airflow administration (i.e. not specific to any particular DAG). Many of these pages can be used to both view and modify parts of your Airflow environment.
For example, the Connections page shows all Airflow connections stored in your environment. You can click on the + to add a new connection. For more information, check out our guide on connections.
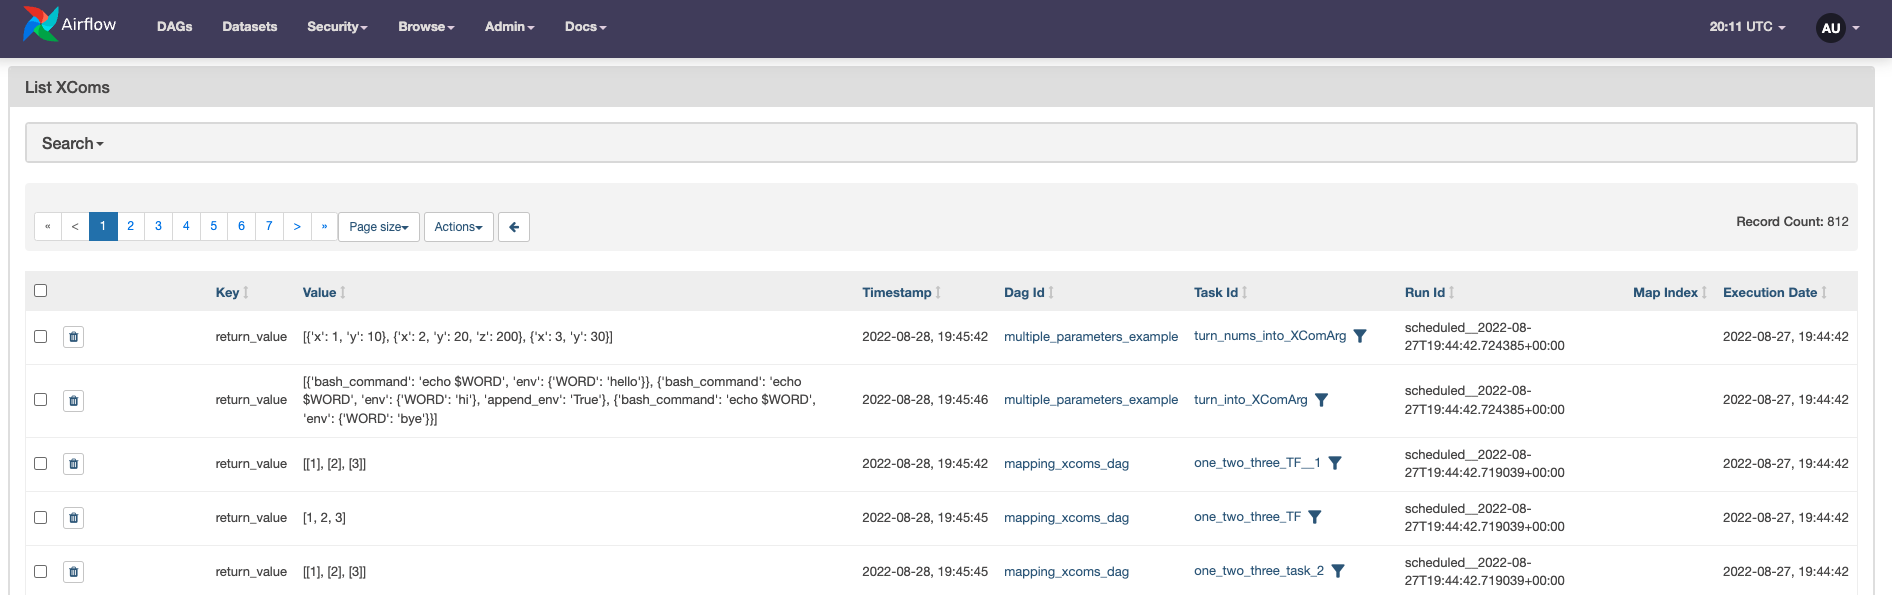
Similarly, the XComs page shows a list of all XComs stored in the metadata database and allows you to easily delete them.
Other pages in the Admin tab include:
- Variables: View and manage Airflow variables.
- Configurations: View the contents of your
airflow.cfgfile. Note that this can be disabled by your Airflow admin for security reasons. - Plugins: View any Airflow plugins defined in your environment.
- Providers: View all Airflow providers included in your Airflow environment with their version number.
- Pools: View and manage Airflow pools.
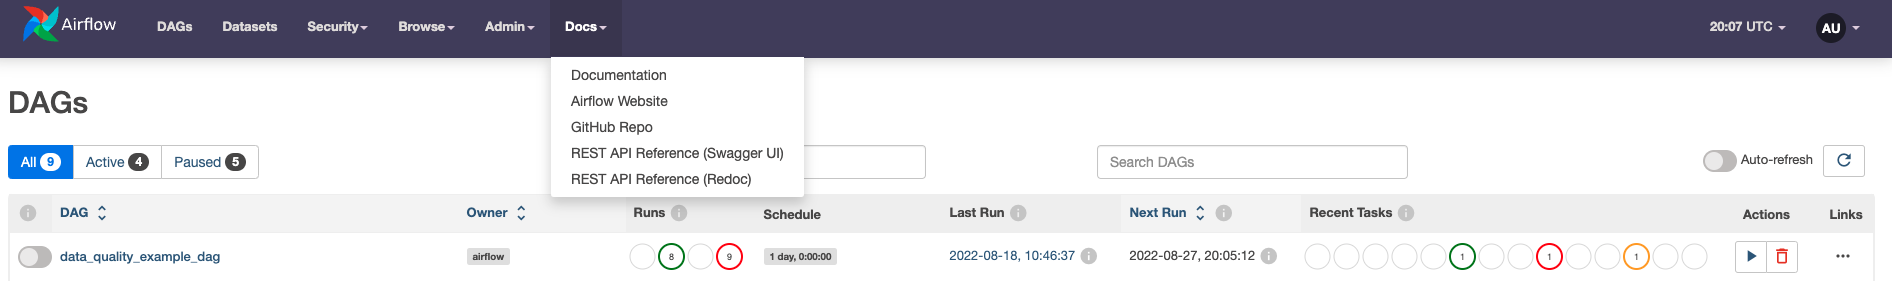
The Docs tab provides links out to external Airflow resources including:
- Airflow documentation
- The Airflow website
- The Airflow GitHub repo
- The REST API Swagger and the Redoc documentation
This guide provided a basic overview of some of the most commonly used features of the Airflow UI. It is not meant to be comprehensive, and we highly recommend diving in yourself to discover everything the Airflow UI can offer.
The Airflow community is consistently working on improvements to the UI to provide a better user experience and additional functionality. Make sure you upgrade your Airflow environment frequently to ensure you are taking advantage of Airflow UI updates as they are released.