Functional Classifications
Video demonstrating how to perform Functional Classification Analysis
Benchmark dose (BMD) values are used as input for defined category analysis. Probeset identifiers are merged based on their NCBI Entrez Gene identifiers. When two or more probesets are associated with a single gene, the BMDs are averaged to obtain a single value corresponding to the Entrez ID. The Entrez IDs are then matched to various functional classifications. Included by default in BMDExpress 2 are:
- Individual Gene Analysis
-
Gene Ontology
- Universal
- Biological processes
- Molecular functions
- Cellular component
- Signaling Pathway
- Defined category
- User defined genes sets (e.g., signatures or proprietary pathway sets)
Summary values representing the central tendencies and associated variability of the BMDs and benchmark dose lower and upper confidence limits (BMDL and BMDU) for the genes in each category are calculated. In the case of "Individual Gene Analysis", single genes are the category, providing averages over multiple probesets for a given gene.
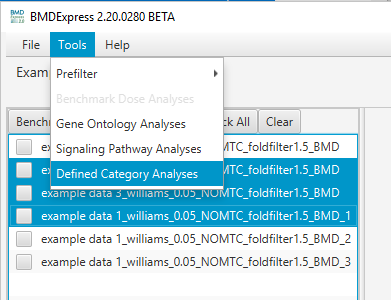
Choose the desired BMD result set(s) in the Data Selection Area, and select either:
Tools > Individual Gene AnalysisTools > Gene Ontology AnalysisTools > Signaling Pathway AnalysisTools > Defined Category Analysis
-
Individual Gene: Uses the annotation associated with platform that was applied when the expression data loaded into the program
-
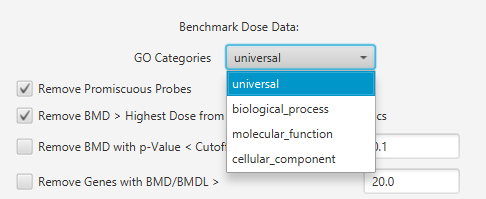
Gene Ontology: Select the class of GO category for the analysis.
- Signaling Pathways: Select the signaling pathway (Reactome or BioPlanet) categories for the analysis.

-
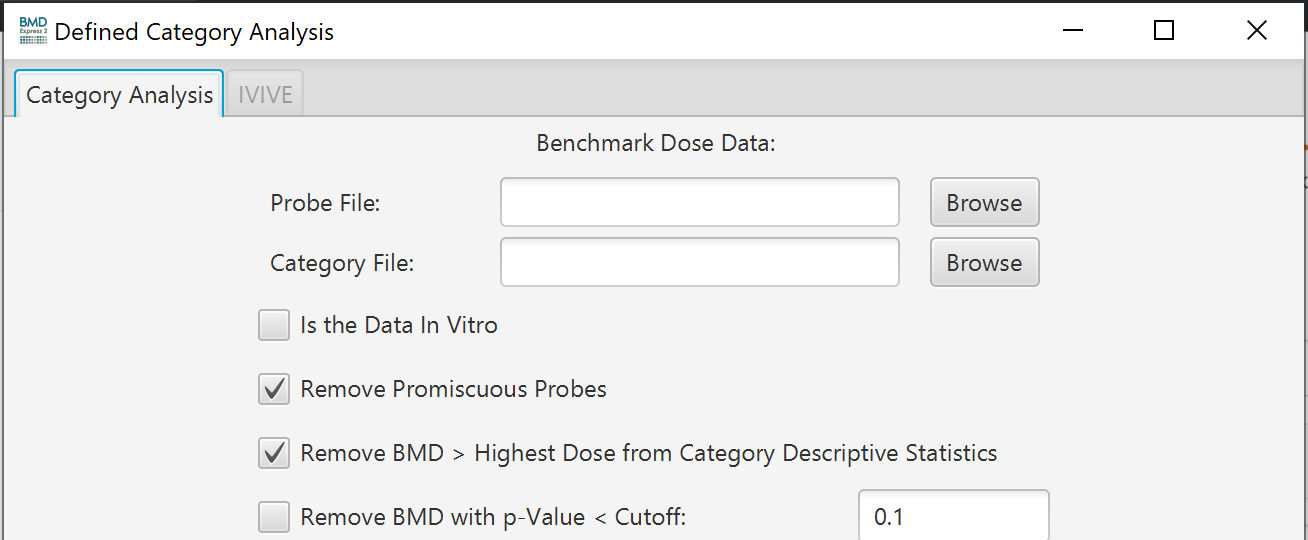
Defined Category Analysis: The defined category analysis provides the option to perform a functional classification with special categories defined by the user. These can be proprietary databases of signaling pathways, disease annotations, or any other grouping of genes and associated annotations. Select
Tools > Defined Category Analyses.
-
Defined category analyses require two tab-delimited input files from the user:
-
Probe Map File: (Must include at least two columns)
- Probe set or probe identifiers
- Component identifiers (usually gene identifiers)
- Example Probe Map File
- Category Map File: (Must include at least three columns) - Category identifier: Unique Identifier of a pathway. - Category name: Descriptive name of a pathway. - Category component: Individual gene, only one per row. - Example Category Map File
-
Probe Map File: (Must include at least two columns)
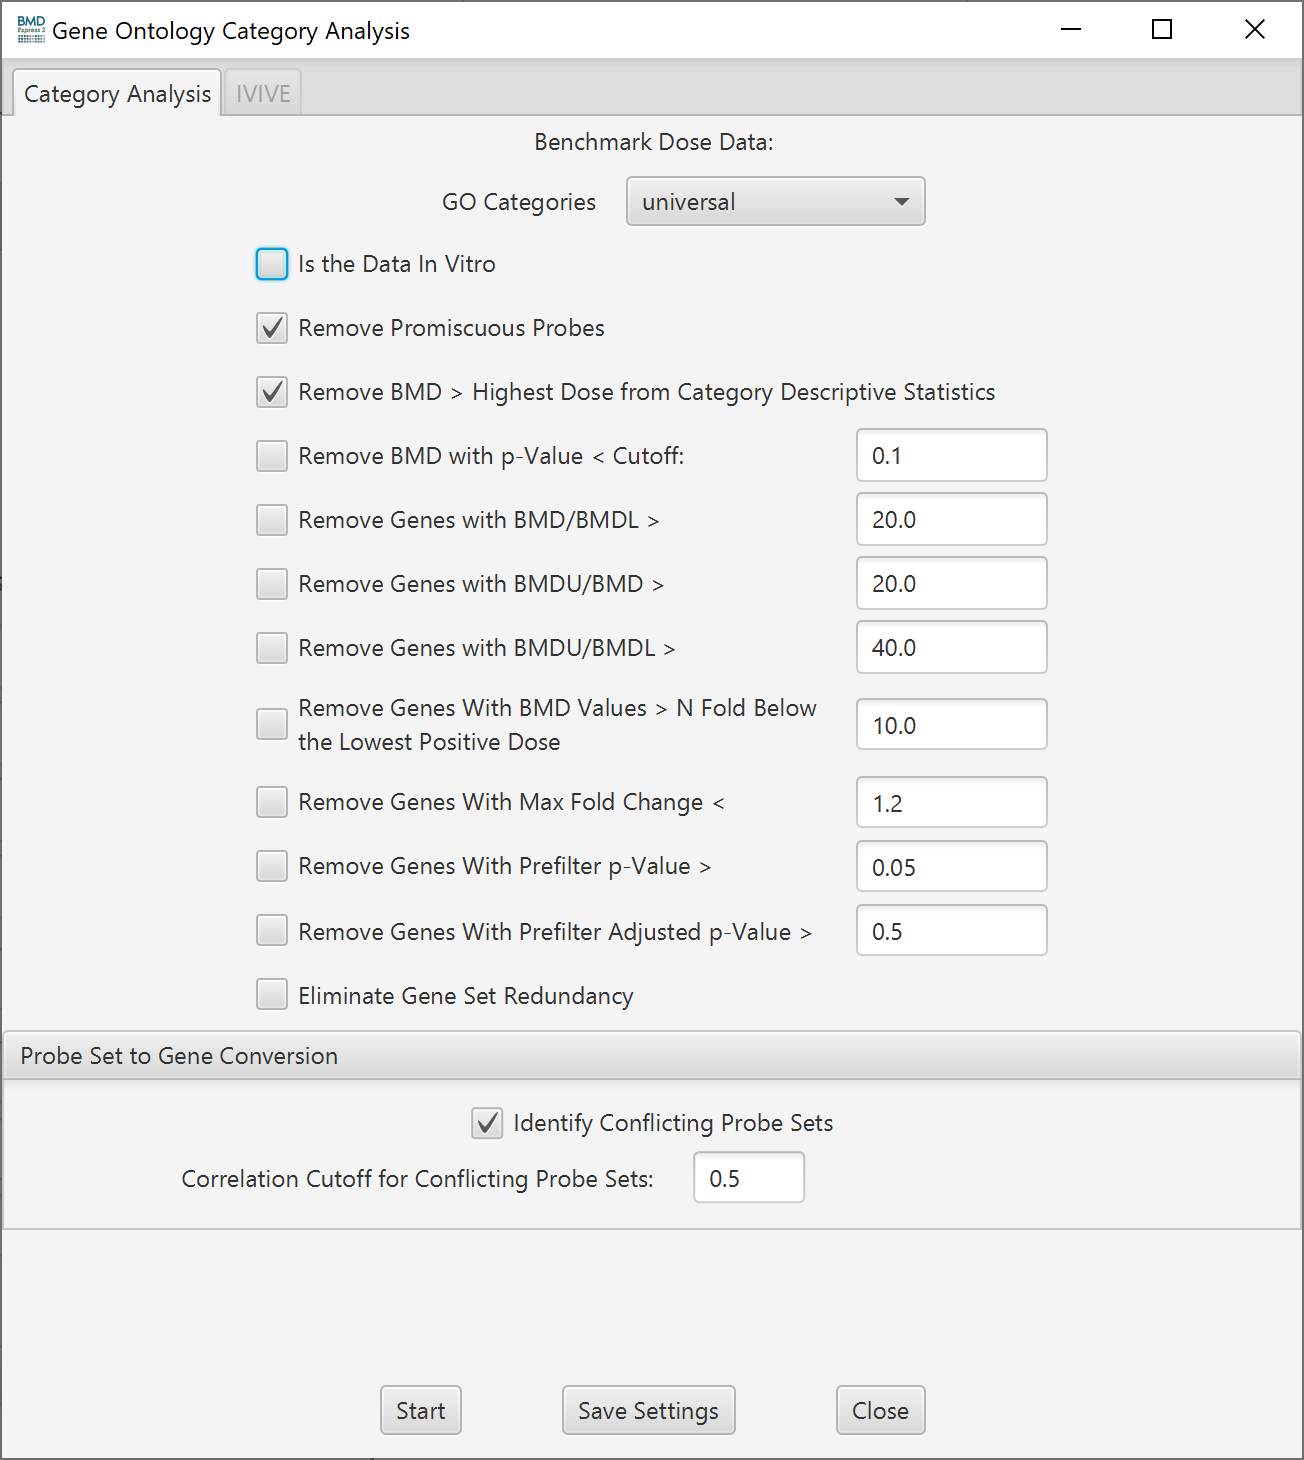
Note: The setup screen for a Gene Ontology Analysis is shown here, but Individual Gene, Signaling Pathway and Defined Category Analysis use the same options below. The only difference is selecting which categories to use.
-
Functional Classification Setup Options
- Is the Data In Vitro: If your data is from an in vitro test system and you would like to convert the in vitro BMD values to in vivo Oral equivalent doses then tick the "Is the Data In Vitro" checkbox to activate the IVIVE tab in the Functional Classification setup. Once ticked the IVIVE tab will become active. Note: The first time the check box is selected it may take moment for the IVIVE tab to become active because software is indexing parameters for ~700,000 chemicals.
- Remove promiscuous probes: When selected probes that map to more than one gene are removed from the functional classification analysis
- Remove BMD > Highest Dose for Category Descriptive Statistics: Remove probesets/features where the BMD is greater than the highest dose. Removing these probesets/features removes BMDS that are based on extrapolation beyond the measured dose range.
- Remove BMD with p-Value < Cutoff: Remove probesets/features where the best model’s goodness-of-fit p-value < the defined cutoff. A likelihood ratio test is used to test whether the dose-related changes in mean response are significantly different from the fitted model values. If the p-value is low, there is a significant difference and therefore the model does not adequately describe the data. On the other hand, a high p value (> 0.1) indicates that the model appears to be adequate to describe the data.
- Remove genes with BMD/BMDL: Filter based on the degree of uncertainty in the lower bound of the BMD estimate.
- Remove genes with BMDU/BMD: Filter based on the degree of uncertainty in the upper bound of the BMD estimate .
- Remove genes with BMDU/BMDL: Filter based on the overall degree of uncertainty in the BMD estimate.
- Remove genes with BMD values N fold below the lowest positive dose: Filter out unrealistically small BMDs.
- Remove genes with maximum fold change: Allows for filtering of probes based on fold change if the prefilter was run at a lower threshold. The value that is filtered on can be found in the column labeled data table in the Benchmark Dose Analysis Section entitled "Max Fold Change Absolute Value". NOTE: If a prefilter was applied previously in the analysis workflow which removed probes, the probes can not be restored by using a lower threshold at this step.
- Remove genes with Prefilter p-value: Allows for filtering of probes based on the prefilter p-value if the prefilter was run at a lower threshold. The value that is filtered on can be found in the column labeled data table in the Benchmark Dose Analysis Section entitled "Prefilter P-value". NOTE: If a prefilter was applied previously in the analysis workflow which removed probes, the probes can not be restored by using a lower threshold at this step.
- Remove genes with Prefilter Adjusted p-value: Allows for filtering of probes based on the adjusted prefilter p-value if the prefilter was run at a lower threshold. The value that is filtered on can be found in the column labeled data table in the Benchmark Dose Analysis Section entitled "Prefilter Adjusted P-value". NOTE: If a prefilter was applied previously in the analysis workflow which removed probes, the probes can not be restored by using a lower threshold at this step.
- Eliminate Gene Set Redundancy: Identifies gene sets in the Functional Classification that are identically populated with genes from the experiment. This is common with GO terms and large pathway gene sets. If the gene sets are GO terms that are curated in the software and mapped to the platform (via the annotations) then this function first identifies which of the gene sets is more populated based on the "Percentage" populated. If the gene sets are still not differentiated then the gene set with the highest GO level (most specific) is selected. If there is still no differentiation between the gene sets then remaining identically populated gene sets are reported. In the case of Signaling Pathway Analysis and Defined Category Analysis only "Percentage" populated is considered and if differentiation is not possible then remaining identically the populated gene sets are reported.
- Minimum Recommended Settings: It is recommended that the user employ "Remove BMD with p-Value < Cutoff: 0.1" and "Remove genes with BMDU/BMDL >: 40" when running a Functional Classification. Depending on how the Prefilter step was performed the user may want to apply additional filtering for fold change and/or prefilter p-value to remove probes/genes not demonstrating significant change and/or effect size.
-
Feature (Probeset/Probe) to Gene Conversion
-
Multiple features mapping to the same gene: Functional classification analyses are inherently gene-based while microarrays or other gene expression technology are based on probesets or probes (aka, features). In most cases there is only one probe or probe set per gene. In some cases, due to alternative splicing or annotation differences multiple features (probes/probesets) representing the same gene are incorporated into a gene expression platform. When this occurs the software determines the average of the BMD, BMDL and BMDU values of the multiple features and assigns those values to the gene (identical to averaging for Individual Gene Analysis).
-
Identify Conflicting features: Due to either biological or technical reasons, it is possible that the expression levels of the different probesets or probes that map to the same gene conflict. To identify genes with potentially conflicting probesets or probes, the user must check the
Identify Conflicting Probesetsbox and input a minimum correlation cutoff. Correlation coefficients are calculated between all probe sets or probes associated with a specific gene across the different doses. -
Correlation cutoff for conflicting features: Genes with probe sets or probes not matching the minimum correlation cutoff are identified in the output.
-
Video demonstrating how to perform IVIVE analysis
The IVIVE feature provides a conversion of the user’s in vitro concentration data to an oral daily dose equivalent. The oral daily dose equivalent allows for the direct comparison of in vitro experimental data to in vivo exposures of interest (e.g., estimated or allowable intake levels). Specifically, BMDExpress 2 provides an IVIVE workflow based on a pure java implementation of EPA's HTTK R-package v1.8 directly and without the need for the user to perform additional work.
The HTTK R-package contains many options to estimate equivalent doses. Within BMDExpress, the IVIVE oral equivalent doses are calculated using calc_mc_oral_equiv and the 3 compartment steady-state model. This model estimates the constant administered oral equivalent dose per day that would lead to blood level equivalent to benchmark dose estimated for a pathway or gene from the in vitro data. Important general HTTK model assumptions include: 100% bioavailability, and chemical leaves the body either by passive glomerular filtration or metabolism (changed into a metabolite). Default values for input parameters are used, with the exception of those provided by the user:
- MW: molecular weight (g/mol)
- LogP: lipophilicity
- pKa Donor: pH(s) at which hydrogen acceptor sites (if any) are at equilibrium
- pKa Acceptor: pH(s) at which hydrogne donor sites (if any) are at equilibrium
- CLint: instrinsic metabolic clearance (µL/min/10^6 hepatocytes)
- FUp: fraction of chemical free (i.e., unbound) in the presence of plasma
- Dose Units: in vitro concentration units (µM, nM, pM)
- Output units: desired output units (mg/kg/day or mmol/kg/day)
- Quantile: desired concentration quantile to sample (between 0-1). Note that 95th concentration quantile is the same population as the 5th dose quantile. For more protective estimates, this parameter is by default to the 0.95 quantile
- Species: species desired for the oral equivalent estimation (human, rat, rabbit, dog, mouse)
BMDExpress 2 carries with it an embedded database of chemical identifiers, with properties (MW, LogP, pKa Donor, pKa Acceptor, CLint, FUp). It is derived from the default table provided by the HTTK package, Sipes et al. 2017, and ICE 2.0 OPERA.
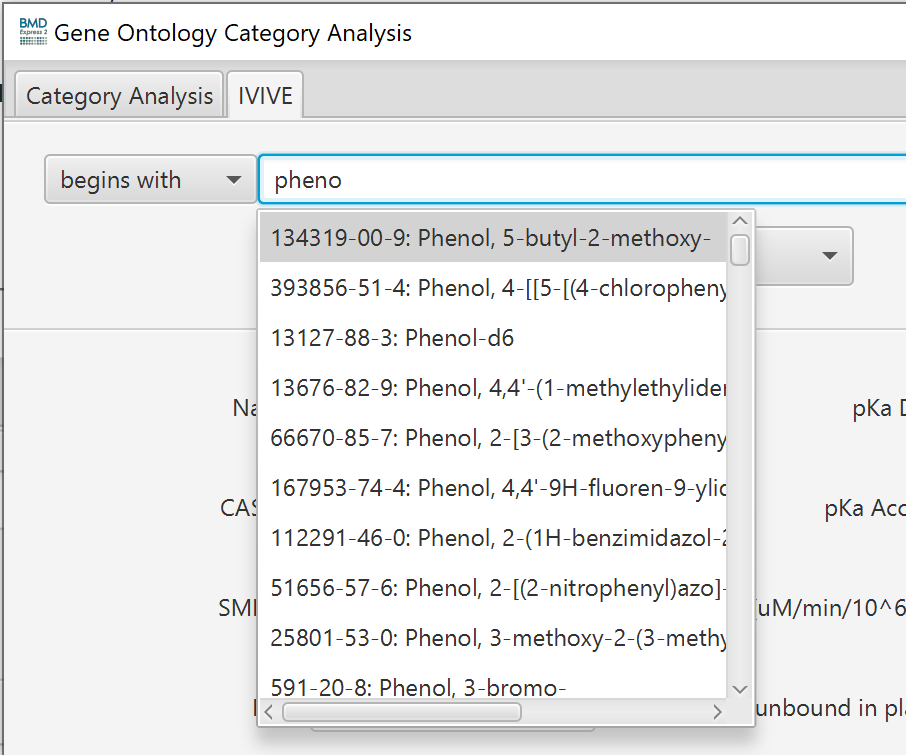
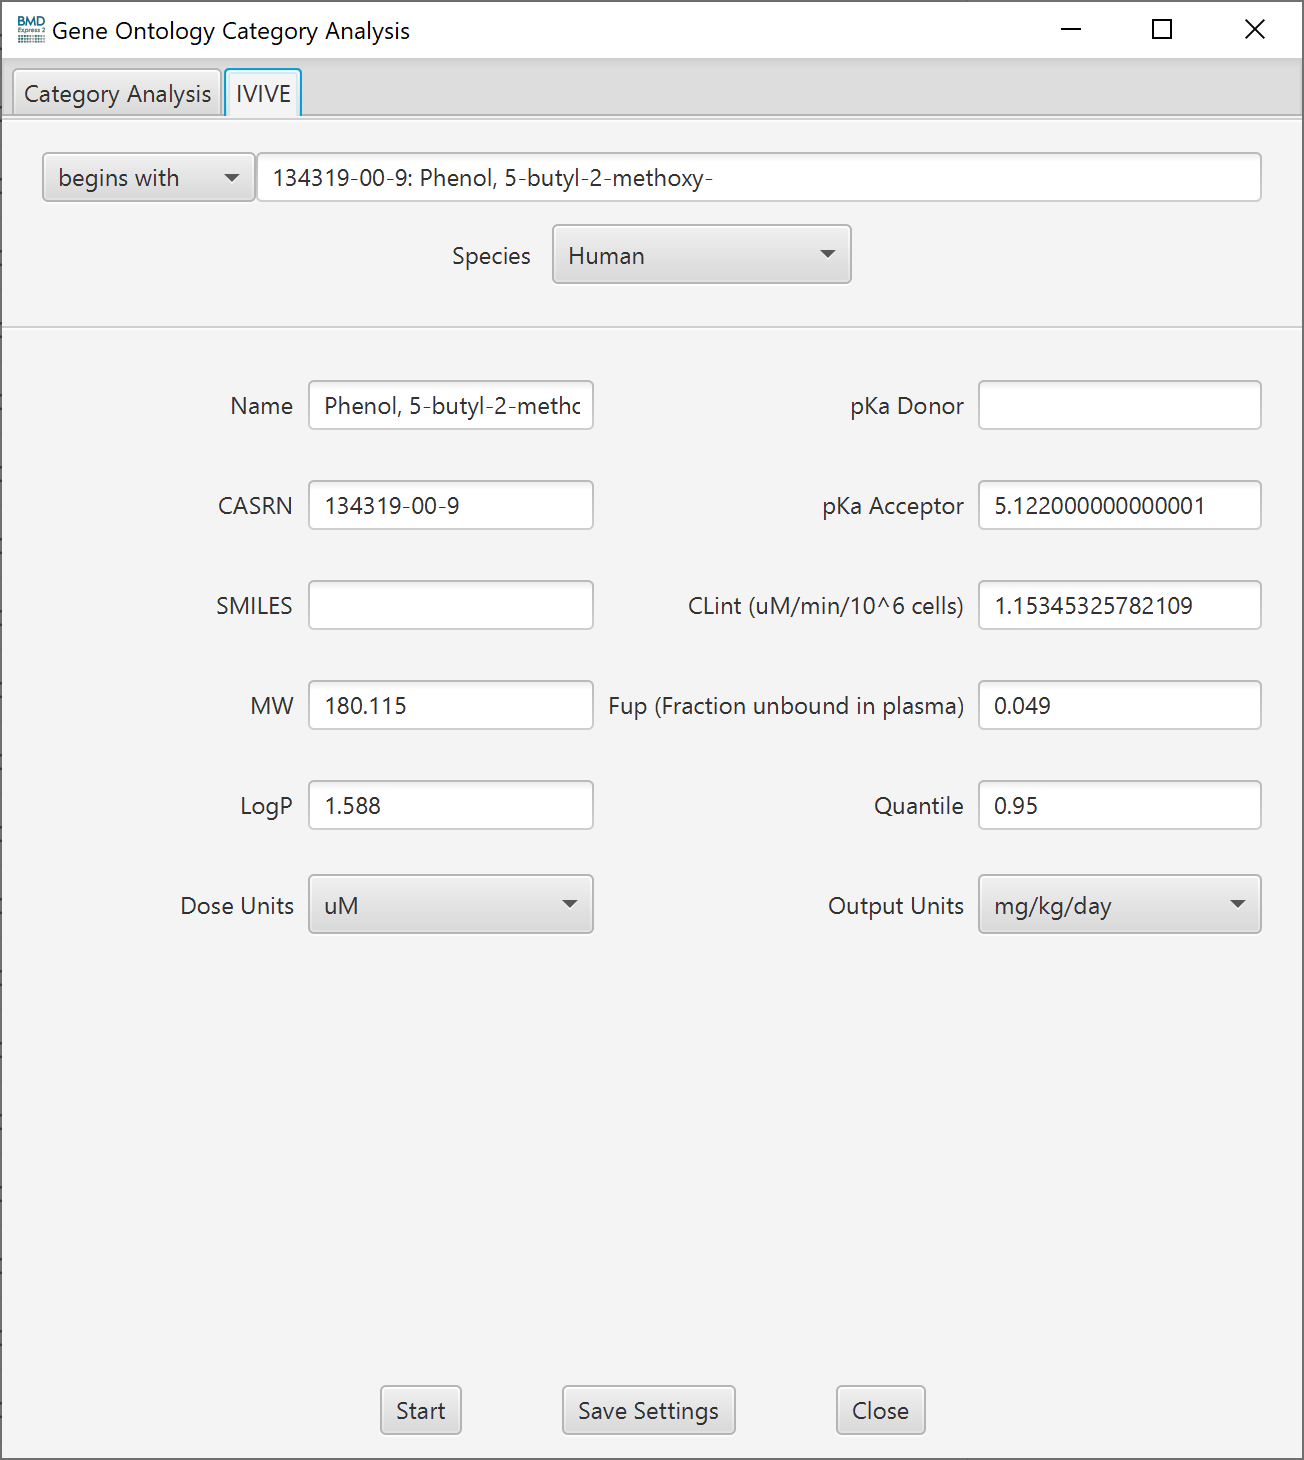
To perform an IVIVE analysis, first tick the check box "is in vitro data" on the front tab of the Functional Classification setup. The IVIVE tab will then become enabled. Once on the IVIVE tab, type a chemical name and/or CAS# into the search box. If the database contains a match, the remainder of the form will be filled with database values. with that chemicals properties and auto populate input fields that will then be passed to the calc_mc_oral_equiv function and used to calculate the in-vivo oral equivalent.
Order of precedence for retrieving a chemical’s properties from the embedded DB:
For a given chemical and a given property we first look for the property value in the default HTTK package’s table. If the property is not there, we look for the property value in the Sipes et al. 2017 table, and finally if the property value is not in the Sipes paper, we retrieve it from ICE 2.0 OPERA predictions table.
The user has the option to override any or all parameters via manual entry into the text fields. If a chemical is not present in the database, values must be entered manually.
BMDExpress2 models the 3 compartment steady-state model, which assumes constant oral infusion and 100% absorbtion, and calculates the oral equivalent for the summary fields of the category analysis results.
Video describing functional classification results
The tabular output from functional classification analysis consists of an identifier together with selected descriptors and summary values for each of the categories.
-
Analysis: When multiple selections have been made in the Data Selection Area, the Analysis column contains the experiment's name as displayed in the Data Selection Area.
-
GO/Pathway/Gene Set ID: Category identifier. In the case of GO ID, may be double-clicked to open the corresponding AmiGO web page for the chosen category.
-
GO Level: The level in the hierarchy of the specific GO category.
-
GO/Pathway/Gene Set Name: Name of the GO category, Reactome pathway, or user-defined gene set name.
-
All Genes (Expression Data): Total number of genes in the loaded "Expression Data" that are on the selected array and that have been assigned to the category/pathway. Note1: It is sometimes the case that the end user will perform a statistical filter outside of BMDExpress and then only load the "Expression Data" for those probes that pass the filter. This column is meant to reflect the category gene counts of the filtered data loaded by the user. Note2: The number in this column can differ from "All Genes(Platform)" for a number of reasons, 1) a fraction of probes on the platform were contained in the Expression Data File, 2) In the case where all probes on platform were contained in the expression data file, the user likely selected "Remove Promiscuous Probes" in the Functional Classification set up and are therefore no longer associated with the gene set.
-
All Genes (Platform): Total number of genes on the selected array that have been assigned to the category/pathway.
-
Input Genes: Total number of genes that passed the pre-filter (e.g. ANOVA) and BMD analyses that were assigned to the category and included in Functional Classification analysis.
-
Genes with BMD <= Highest Dose: Number of genes that have BMD values < highest dose.
-
Genes with BMD p-Value >=: Number of genes with fit p-values> the designated value in the set up.
-
Genes with BMD/BMDL <=: Number of genes with BMD/BMDL ratios < than the designated value in the set up.
-
Genes with BMDU/BMD <=: Number of genes with BMDU/BMD ratios < than the designated value in the set up.
-
Genes with BMDU/BMDL <=: Number of genes with BMDU/BMDL ratios < than the designated value in the set up.
-
Genes with BMD <= N-Fold Lowest Positive Dose: Number of genes with BMD values > N-fold below the lowest positive dose.
-
Genes that Passed All Filters: Total number of genes that passed all filters if they are are applied.
-
Fisher’s Exact Left-tailed P-Value: P-value of the enrichment analysis of the gene sets that indicates significant under representation of responsive genes in a gene set. Calculations are based on All genes(platform).
-
Fisher’s Exact Right-tailed P-Value: P-value of the enrichment analysis of the gene sets that indicates significant over representation of responsive genes in a gene set. Calculations are based on All genes(platform).
-
Fisher’s Exact Two-Tailed P-Value: P-value of the enrichment analysis of the gene sets based on Fischer's Exact Two-Tailed test. A low p-value here could indicate either significant over or under representation based on what would be expected by random chance. Calculations are based on All genes(platform).
The Fishers exact test is calculated based on a constructed 2x2 matrix using the standard test, which is described here.
# genes related to Category Term # genes not related to Category Term with BMD a b without BMD c d The parameters are:
- Number of genes that are related to the Category term that have a BMD value and pass all filters applied in functional classification set up.
- Number of genes that are not related to the Category term that have a BMD value and pass all filters applied in functional classification set up.
- Number of genes that are related to the Category term that do not have a BMD value.
- Number of genes that are not related to the Category term and do not have a BMD value.
For each category returned by the Category Analysis we ran the test for by creating the 2x2 matrix and passing it to the Fisher's Exact Test function.
-
Fisher's A parameter: Number of genes that are related to the Category term that have a BMD value and pass all filters applied in functional classification set up.
-
Fisher's B parameter: Number of genes that are not related to the Category term that have a BMD value and pass all filters applied in functional classification set up.
-
Fisher's C parameter: Number of genes that are related to the Category term that do not have a BMD value.
-
Fisher's D parameter: Number of genes that are not related to the Category term and do not have a BMD value.
-
Percentage: The percentage of the total number of genes on the array (All Genes (Platform)) that were used as input from the Benchmark Dose Analysis and had a reportable BMD based on the filter criteria in the setup of the Functional Classification.
-
Gene IDs: The Entrez Gene identifiers from the probe/probe sets used as input from the Benchmark Dose Analysis.
-
Gene Symbols: The unique gene symbols linked to Gene IDs used as input from the “Benchmark Dose Analysis
-
Probe IDs: The Affymetrix probe set or Agilent probe identifiers used as input from the Benchmark Dose Analysis.
-
Genes with Conflicting Probe Sets: If the “Identify Conflicting Probe Sets” option was selected, the Entrez Gene identifiers of genes with conflicting probe sets or probes will be displayed. The correlation coefficient for each identifier is provided in parentheses.
-
BMD Mean: The mean benchmark dose (BMD) for the genes in the category. This is the mean for only those genes that had a calculated BMD from the Benchmark Dose Analysis.
-
BMD Median: The median benchmark dose (BMD) for the genes in the category. This is the median for only those genes that had a calculated BMD from the Benchmark Dose Analysis.
-
BMD Minimum: The minimum benchmark dose (BMD) for the genes in the category. This is the minimum for only those genes that had a calculated BMD from the Benchmark Dose Analysis.
-
BMD Standard Deviation: The standard deviation of the benchmark dose (BMD) for the genes in the category. This is the standard deviation for only those genes that had a calculated BMD from the Benchmark Dose Analysis.
-
BMD wMean: The weighted mean benchmark dose (BMD) for the genes in the category. This is the mean for only those genes that had a calculated BMD with the goodness-of-fit p-value from the Benchmark Dose Analysis as the weight.
-
BMD wSD: The standard deviation of the benchmark dose (BMD) for the genes in the category. This is the standard deviation for only those genes that had a calculated BMD with the goodness-of-fit p-value from the Benchmark Dose Analysis as the weight.
-
BMDL Mean: The mean benchmark dose lower confidence limit (BMDL) for the genes in the category. This is the mean for only those genes that had a calculated BMD from the Benchmark Dose Analysis.
-
BMDL Median: The median benchmark dose lower confidence limit (BMDL) for the genes in the category. This is the median for only those genes that had a calculated BMD from the Benchmark Dose Analysis.
-
BMDL Minimum: The minimum benchmark dose lower confidence limit (BMDL) for the genes in the category. This is the minimum for only those genes that had a calculated BMD from the Benchmark Dose Analysis.
-
BMDL Standard Deviation: The standard deviation of the benchmark dose lower confidence limit (BMDL) for the genes in the category. This is the standard deviation for only those genes that had a calculated BMD from the Benchmark Dose Analysis.
-
BMDL wMean: The weighted mean benchmark dose lower confidence limit (BMDL) for the genes in the category. This is the mean for only those genes that had a calculated BMD with the goodness-of-fit p-value from the Benchmark Dose Analysis as the weight.
-
BMDL wSD: The standard deviation of the benchmark dose lower confidence limit (BMDL) for the genes in the category. This is the standard deviation for only those genes that had a calculated BMD with the goodness-of-fit p-value from the Benchmark Dose Analysis as the weight.
-
BMDU Mean: The mean benchmark dose upper confidence limit (BMDU) for the genes in the category. This is the mean for only those genes that had a calculated BMD from the Benchmark Dose Analysis.
-
BMDU Median: The median benchmark dose upper confidence limit (BMDU) for the genes in the category. This is the median for only those genes that had a calculated BMD from the Benchmark Dose Analysis.
-
BMDU Minimum: The minimum benchmark dose upper confidence limit (BMDU) for the genes in the category. This is the minimum for only those genes that had a calculated BMD from the Benchmark Dose Analysis.
-
BMDU Standard Deviation: The standard deviation of the benchmark dose upper confidence limit (BMDU) for the genes in the category. This is the standard deviation for only those genes that had a calculated BMD from the Benchmark Dose Analysis.
-
BMDU wMean: The weighted mean benchmark dose upper confidence limit (BMDU) for the genes in the category. This is the mean for only those genes that had a calculated BMD with the goodness-of-fit p-value from the Benchmark Dose Analysis as the weight.
-
BMDU wSD: The standard deviation of the benchmark dose upper confidence limit (BMDU) for the genes in the category. This is the standard deviation for only those genes that had a calculated BMD with the goodness-of-fit p-value from the Benchmark Dose Analysis as the weight.
-
5th Percentile Index: This is the Nth gene number that represents the 5th percentile for all the genes in the category. The value is zero-based and a 0.5 value means that it falls between two values. For example if there are 100 genes in a category the 5th gene would represent the 5th percentile. If there were 50 genes in a category then the 2nd or 3rd gene (represented in the table as "1.5") would represent the 5th percentile
-
BMD at 5th Percentile of Total Genes: The benchmark dose (BMD) at the 5th percentile for all genes in the GO category (including genes with no significant dose response). For example, if there were 100 total genes in the GO category and 15 of the 100 genes were run in the Benchmark Dose Analysis, the 15 genes would be rank ordered by their BMDs and the BMD for the 5th gene would be selected.
-
10th Percentile Index: This is the Nth gene number that represents the 10th percentile for all the genes in the category. The value is zero-based and a 0.5 value means that it falls between two values.For example if there are 100 genes in a category the 10th gene would represent the 10th percentile.
-
BMD at 10th Percentile of Total Genes: The benchmark dose (BMD) at the 10th percentile for all genes in the GO category (including genes with no significant dose response). For example, if there were 100 total genes in the GO category and 15 of the 100 genes were run in the Benchmark Dose Analyses, the 15 genes would be rank ordered by their BMDs and the BMD for the 10th gene would be selected.
-
BMD List: List of BMD values for genes in the set.
-
BMDL List: List of BMD values for genes in the set.
-
BMDU List: List of BMDU values for genes in the set.
-
Probes with Adverse Direction Up: The number of probe sets or probes in the GO category for which the final adverse direction was in the up (i.e., increased) direction.
-
Probes with Adverse Direction Down: The number of probe sets or probes in the GO category for which the final adverse direction was in the down (i.e., decreased) direction.
-
Genes with Adverse Direction Up: Number of genes in a set that exhibit adverse direction up.
-
Genes Up List: Genes (Entrez Gene IDs) with an up adverse direction.
-
Genes Up Probes List: Probes/probe sets with an up adverse direction.
-
Genes Up BMD Mean: BMD means for genes with up adverse direction. List corresponds with the Genes Up List.
-
Genes Up BMD Median: BMD medians for genes with up adverse direction. List corresponds with the Genes Up List.
-
Genes Up SD: BMD standard deviations for genes with up adverse direction. List corresponds with the Genes Up List.
-
Genes Up BMDL Mean: BMDL means for genes with up adverse direction. List corresponds with the Genes Up List.
-
Genes Up BMDL Median: BMDL medians for genes with up adverse direction. List corresponds with the Genes Up List.
-
Genes Up BMDL SD: BMDL standard deviations for genes with up adverse direction. List corresponds with the Genes Up List.
-
Genes Up BMDU Mean: BMDU means for genes with up adverse direction. List corresponds with the Genes Up List.
-
Genes Up BMDU Median: BMDU medians for genes with up adverse direction. List corresponds with the Genes Up List.
-
Genes Up BMDU SD: BMDU standard deviations for genes with up adverse direction. List corresponds with the Genes Up List.
-
BMD List (up): Semi-colon separated list of BMD values. Corresponds with the Genes Up List.
-
BMDL List (up): Semi-colon separated list of BMDL values. Corresponds with the Genes Up List.
-
BMDU List (up): Semi-colon separated list of BMDU values. Corresponds with the Genes Up List.
-
Genes with Adverse Direction Down: Number of genes in a set that exhibit adverse direction down.
-
Genes Down List: Genes (Entrez Gene IDs) with a down adverse direction.
-
Genes Down Probes List: Probes/probe sets with a down adverse direction.
-
Genes Down BMD Mean: BMD means for genes with down adverse direction. List corresponds with the Genes Down List.
-
Genes Down BMD Median: BMD medians for genes with down adverse direction. List corresponds with the Genes Down List.
-
Genes Down SD: Standard deviations for genes with down adverse direction. List corresponds with the Genes Down List.
-
Genes Down BMDL Mean: BMDL Means for genes with down adverse direction. List corresponds with the Genes Down List.
-
Genes Down BMDL Median: BMDL Medians for genes with down adverse direction. List corresponds with the Genes Down List.
-
Genes Down BMDL SD: BMDL standard deviations for genes with down adverse direction. List corresponds with the Genes Down List.
-
Genes Down BMDU Mean: BMDU means for genes with down adverse direction. List corresponds with the Genes Down List.
-
Genes Down BMDU Median: BMDU medians for genes with down adverse direction. List corresponds with the Genes Down List.
-
Genes Down BMDU SD: BMDU standard deviations for genes with down adverse direction. List corresponds with the Genes Down List.
-
BMD List (Down): BMD values. Corresponds with the Genes Down List.
-
BMDL List (Down): BMDL values. Corresponds with the Genes Down List.
-
BMDU List (Down): BMDU values. Corresponds with the Genes Down List.
-
Genes with Adverse Direction Down: List of genes in which adverse direction of model was down.
-
Genes Conflict List: Genes (Entrez Gene IDs) with probes that were not correlated above the designated threshold in the set up for the Functional Classification.
-
Genes Conflict Probes List: Probes mapping to the same gene that were not correlated above the designated threshold in the set up for the Functional Classification.
-
BMD List (Conflict): BMD values from the conflicted probes.
-
BMDL List (Conflict): BMDL values from the conflicted probes.
-
BMDU List (Conflict): BMDU values from the conflicted probes.
-
Model Counts: Semi-colon separated entries for model counts denoting the model, total number of genes for that model, and the percentage of total model fits that model accounts for (e.g., Hill 2,2(0.25); etc…).
-
Mean Fold Change: Mean fold change of the absolute value of the fold change values for the genes in the category.
-
Total Fold Change: Summed fold change of the absolute value of the fold change values for the genes in the category.
-
Standard Deviation Fold Change: Standard deviation of the absolute value of the fold change values for the genes in the category
-
Median Fold Change: Median fold change of the absolute value of the fold change values for the genes in the category.
-
Lower Bound of the 95% confidence interval-BMD: Lower bound of the 95% confidence interval of the BMD values (assumes normal distribution)
-
Upper Bound of the 95% confidence interval-BMD: Upper bound of the 95% confidence interval of the BMD values (assumes normal distribution)
-
Lower Bound of the 95% confidence interval-BMDL: Lower bound of the 95% confidence interval of the BMDL values (assumes normal distribution)
-
Upper Bound of the 95% confidence interval-BMDL: Upper bound of the 95% confidence interval of the BMDL values (assumes normal distribution)
-
Lower Bound of the 95% confidence interval-BMDU: Lower bound of the 95% confidence interval of the BMDU values (assumes normal distribution)
-
Upper Bound of the 95% confidence interval-BMDU: Upper bound of the 95% confidence interval of the BMDU values (assumes normal distribution)
-
Overall Direction: "Up" indicates > 60% genes in the category show up-regulation, "Down" indicates >60% show down-regulation and "Conflict" indicates neither "Up" or "Down" criteria were met.
-
Percent Genes With Overall Direction Up: Fraction of genes that are up-regulated based on adverse direction up of genes.
-
Percent Genes With Overall Direction Down: Fraction of genes that are down-regulated based adverse direction down of genes.
-
Percent Genes With Overall Direction Conflict: Fraction of genes that have probes that are both down and up-regulated (i.e. one probe down-regulated and another up-regulated).
BMDExpress 2.0 IVIVE models the 3 compartment steady-state model from HTTK v1.8, and calculates the oral equivalent for the summary fields of the category analysis results. Oral equivalent refers to the oral dose in humans that would produce the BMD(x) result.
- Oral Equivalent BMD Mean: Oral equivalent dose corresponding to the mean benchmark dose (BMD) for the genes in the category.
- Oral Equivalent BMDL Mean: Oral equivalent dose corresponding to the mean benchmark dose lower confidence limit (BMDL) for the genes in the category.
- Oral Equivalent BMDU Mean: Oral equivalent dose corresponding to the mean benchmark dose upper confidence limit (BMDU) for the genes in the category.
- Oral Equivalent BMD Median: Oral equivalent dose corresponding to the median benchmark dose (BMD) for the genes in the category.
- Oral Equivalent BMDL Median: Oral equivalent dose corresponding to the median benchmark dose lower confidence limit (BMDL) for the genes in the category.
- Oral Equivalent BMDU Median: Oral equivalent dose corresponding to the median benchmark dose upper confidence limit (BMDU) for the genes in the category.
- Oral Equivalent BMD Minimum: Oral equivalent dose corresponding to the minimum benchmark dose (BMD) for the genes in the category.
- Oral Equivalent BMDL Minimum: Oral equivalent dose corresponding to the minimum benchmark dose lower confidence limit (BMDL) for the genes in the category.
- Oral Equivalent BMDU Minimum: Oral equivalent dose corresponding to the minimum benchmark dose upper confidence limit (BMDU) for the genes in the category.
- Oral Equivalent BMD Fifth Percentile: Oral equivalent dose corresponding to the benchmark dose (BMD) at the 5th percentile for all genes in the GO category (including genes with no significant dose response). Note that the quantile chosen for the IVIVE calculation is in addition to the fifth percentile used for the BMD calculation.
- Oral Equivalent BMDL Fifth Percentile: Oral equivalent dose corresponding to the minimum benchmark dose lower confidence limit (BMDL) at the 5th percentile for all genes in the GO category (including genes with no significant dose response). Note that the quantile chosen for the IVIVE calculation is in addition to the fifth percentile used for the BMD calculation.
- Oral Equivalent BMDU Fifth Percentile: Oral equivalent dose corresponding to the minimum benchmark dose upper confidence limit (BMDL) at the 5th percentile for all genes in the GO category (including genes with no significant dose response). Note that the quantile chosen for the IVIVE calculation is in addition to the fifth percentile used for the BMD calculation.
- Oral Equivalent BMD Tenth Percentile: Oral equivalent dose corresponding to the benchmark dose (BMD) at the 10th percentile for all genes in the GO category (including genes with no significant dose response). Note that the quantile chosen for the IVIVE calculation is in addition to the tenth percentile used for the BMD calculation.
- Oral Equivalent BMDL Tenth Percentile: Oral equivalent dose corresponding to the minimum benchmark dose lower confidence limit (BMDL) at the 10th percentile for all genes in the GO category (including genes with no significant dose response). Note that the quantile chosen for the IVIVE calculation is in addition to the tenth percentile used for the BMD calculation.
- Oral Equivalent BMDU Tenth Percentile: Oral equivalent dose corresponding to the minimum benchmark dose upper confidence limit (BMDL) at the 10th percentile for all genes in the GO category (including genes with no significant dose response). Note that the quantile chosen for the IVIVE calculation is in addition to the tenth percentile used for the BMD calculation.
Default visualizations are:
-
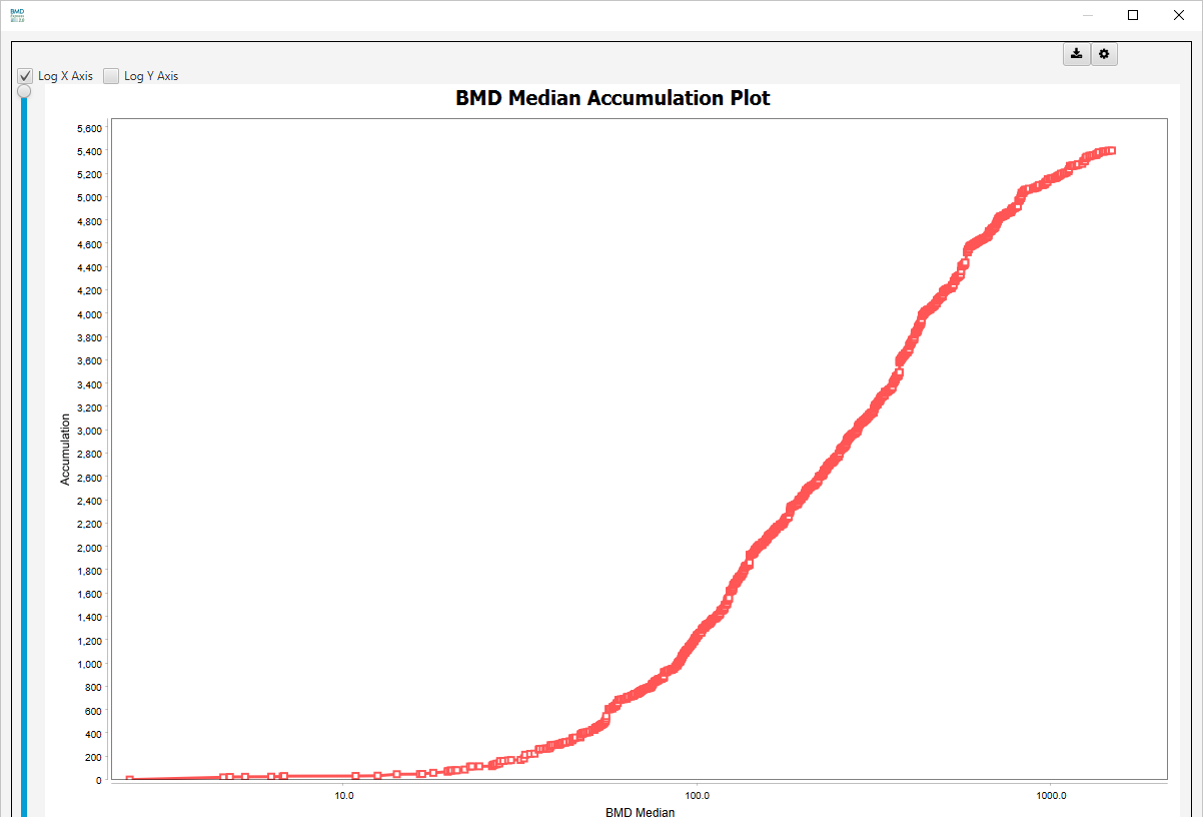
BMD Median Accumulation Plot: A data point represents the number of gene sets (or probes in the BMD Analysis results view) that have BMD <= the corresponding value on the horizontal axis. Note: Sudden y-axis jumps in the accumulation plot are indicative of multiple gene sets having the same median or mean BMD, BMDL or BMDU. Mouse over the spot at the bottom of the sudden increase to see the gene sets with the same BMD values.

-
BMD Median Vs. BMDL Median:

Additional visualizations are available by clicking on Select Chart View dropdown list:
-
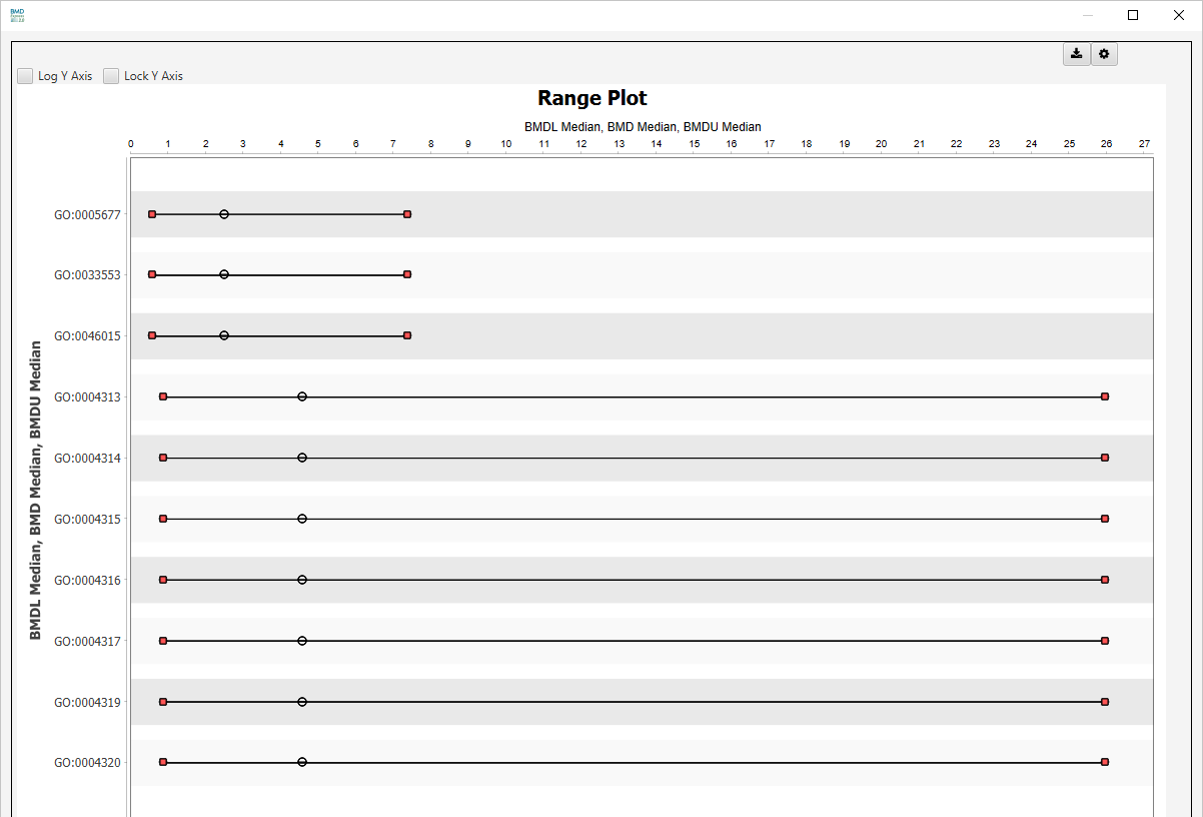
Range Plot
-
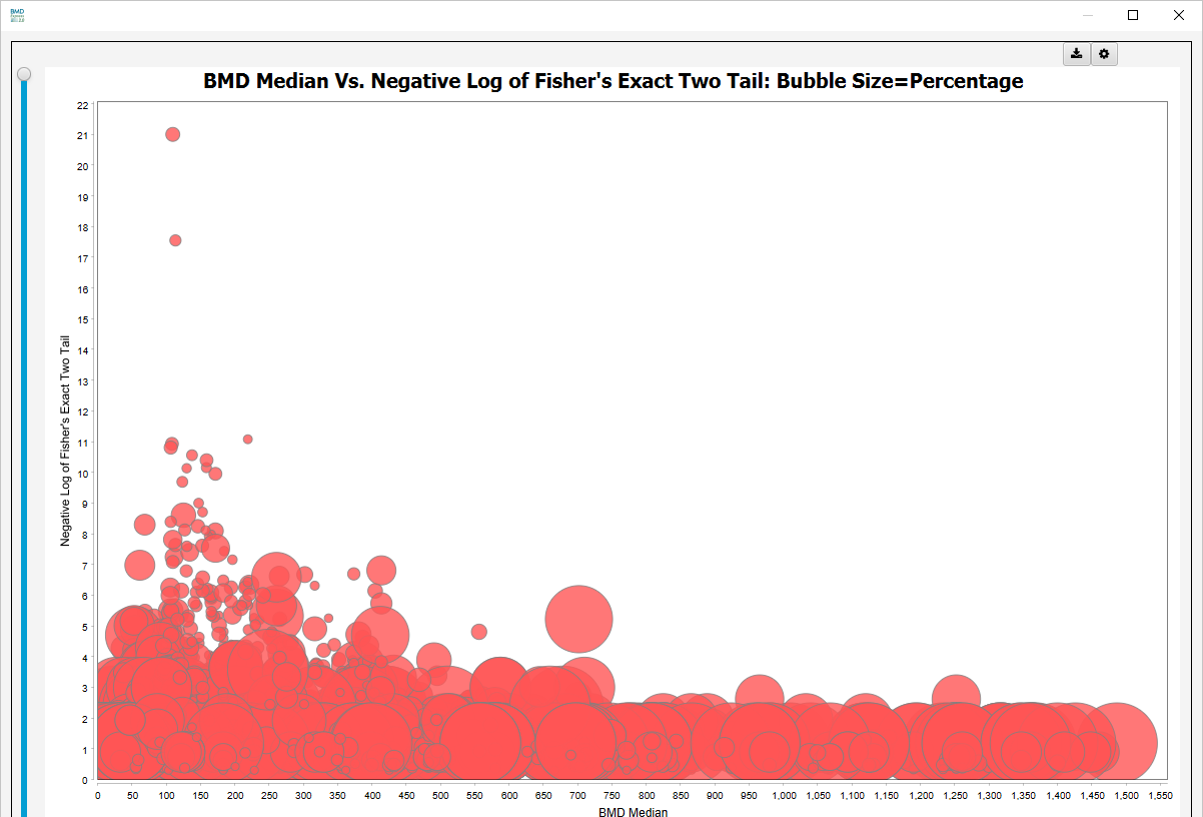
Bubble Chart: BMD Median Vs. Negative Log of Fisher’s Two-Tailed p-value. The bubble size represents percentage of genes in a gene set that pass all filters.
-
BMD and BMDL Bar Charts
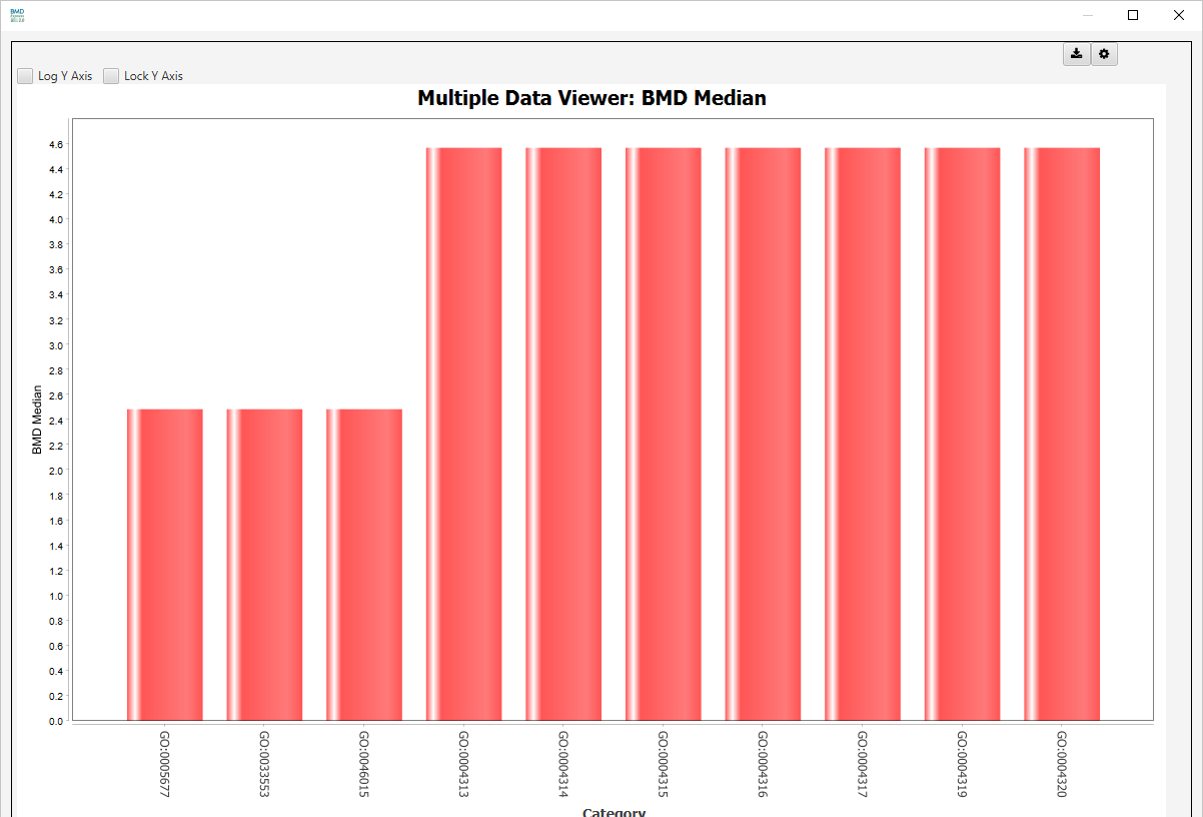
- BMD Median
- BMDL Median
- BMDU Median
- BMD Mean
- BMDL Mean
- BMDU Mean
-
Accumulation Charts
- BMD, BMDL, BMDU | Mean and Median
-
Best Models Pie Chart
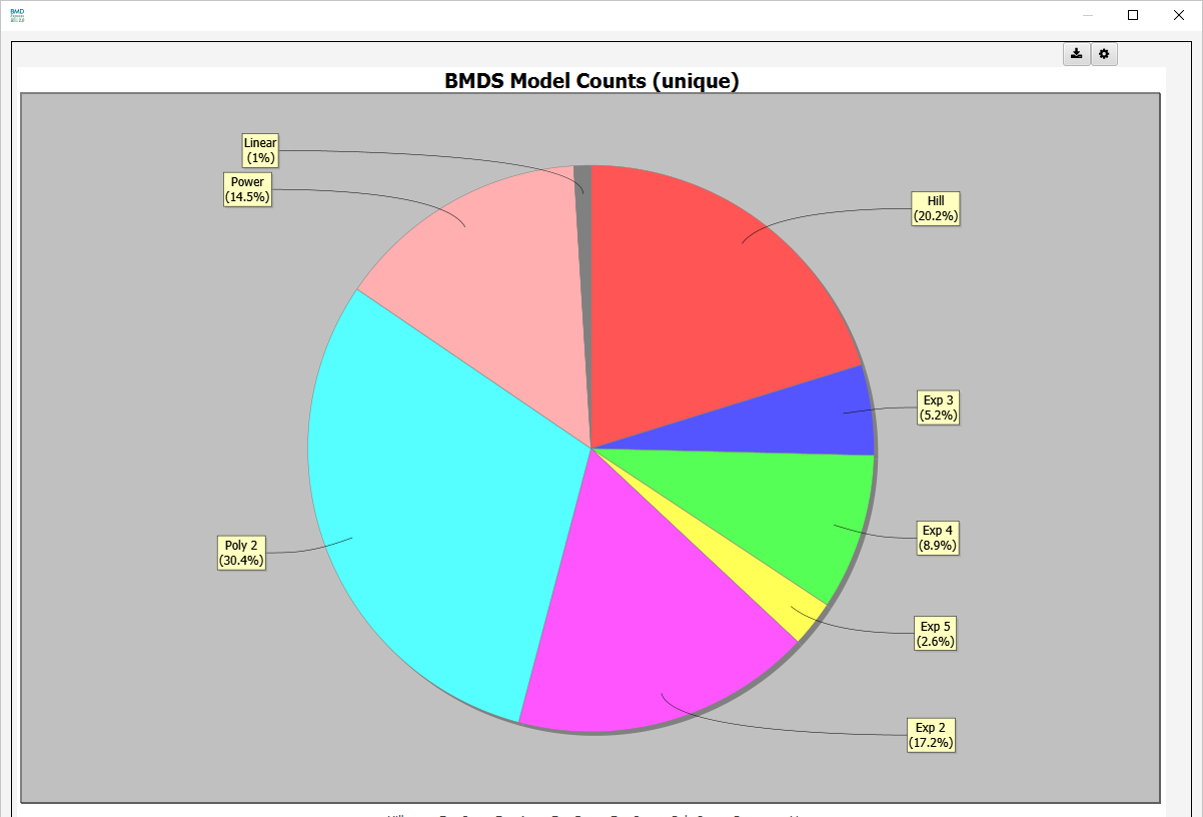
- BMDS Model Counts (unique)
-
Mean Histograms
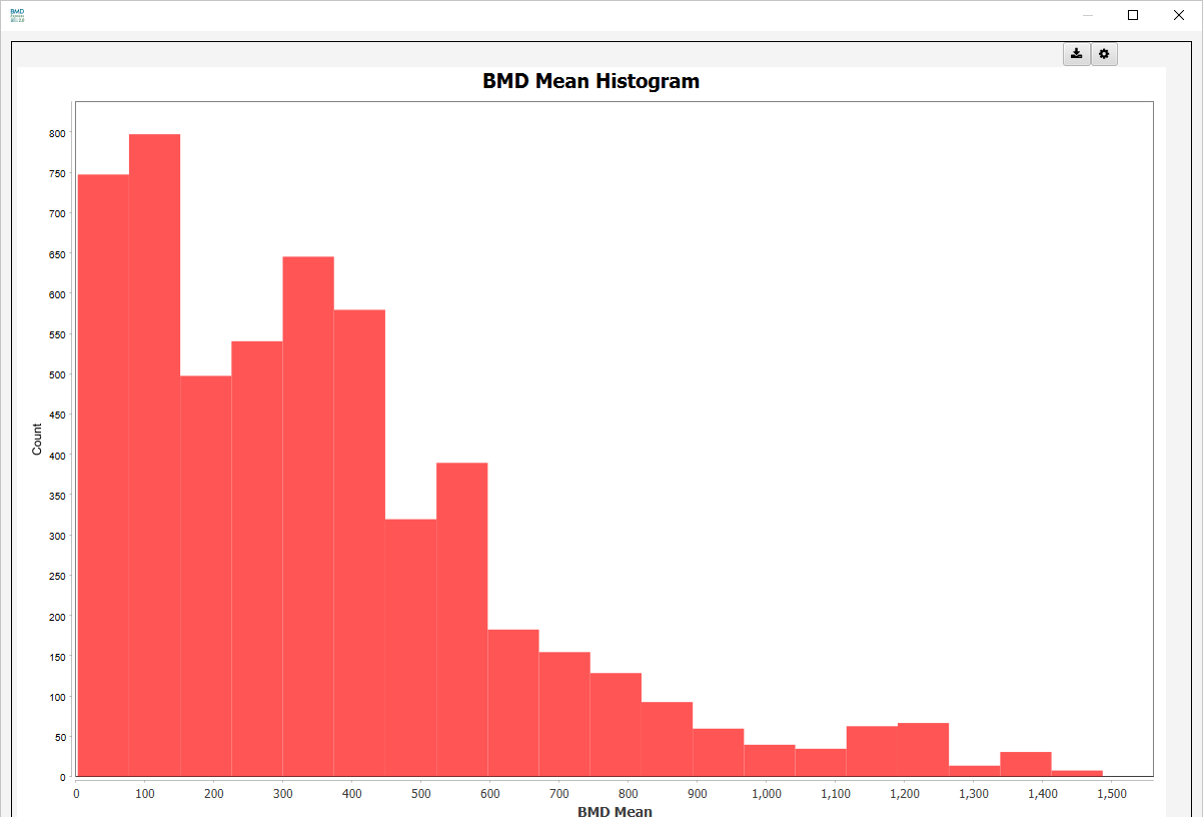
- BMD Mean Histogram
- BMDL Mean Histogram
- BMDU Mean Histogram
- BMD 5th Percentile Histogram
- BMD 10th Percentile Histogram
-
Median Histograms
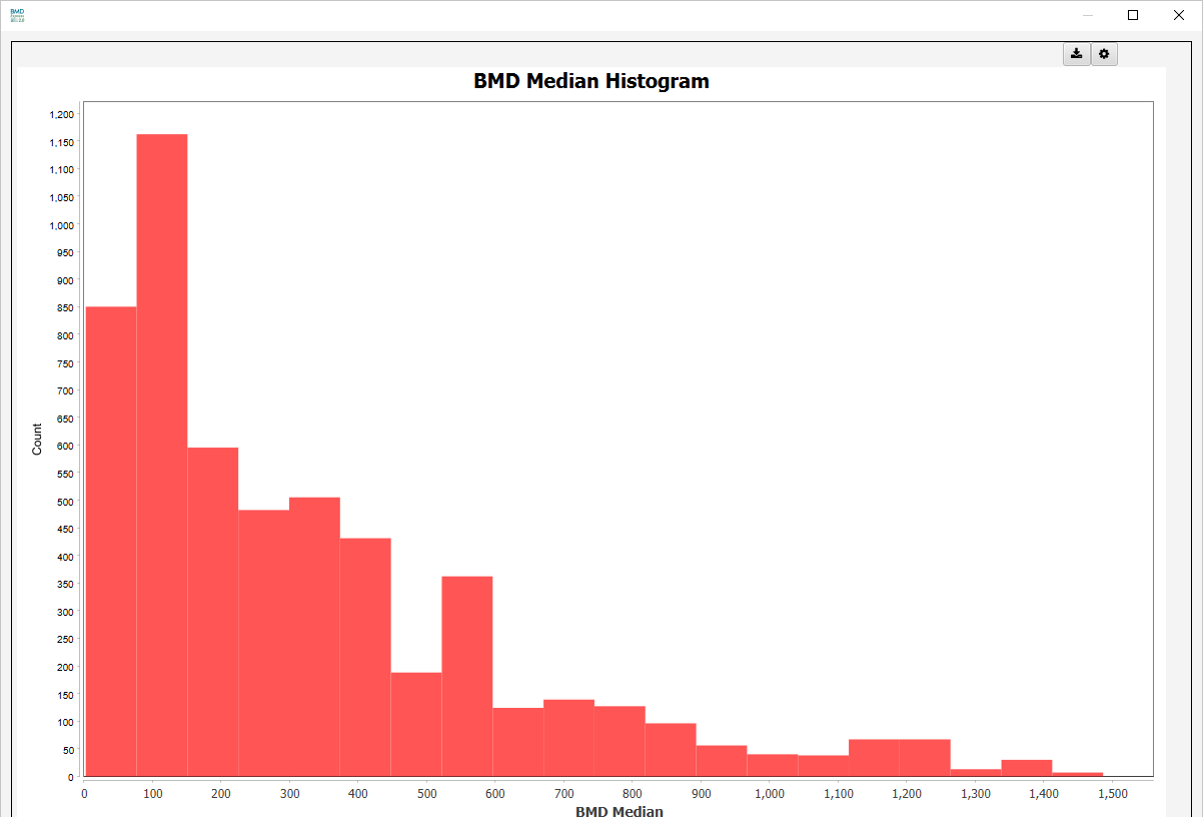
- BMD Median Histogram
- BMDL Median Histogram
- BMDU Median Histogram
-
BMD vs BMDL Scatter Plots
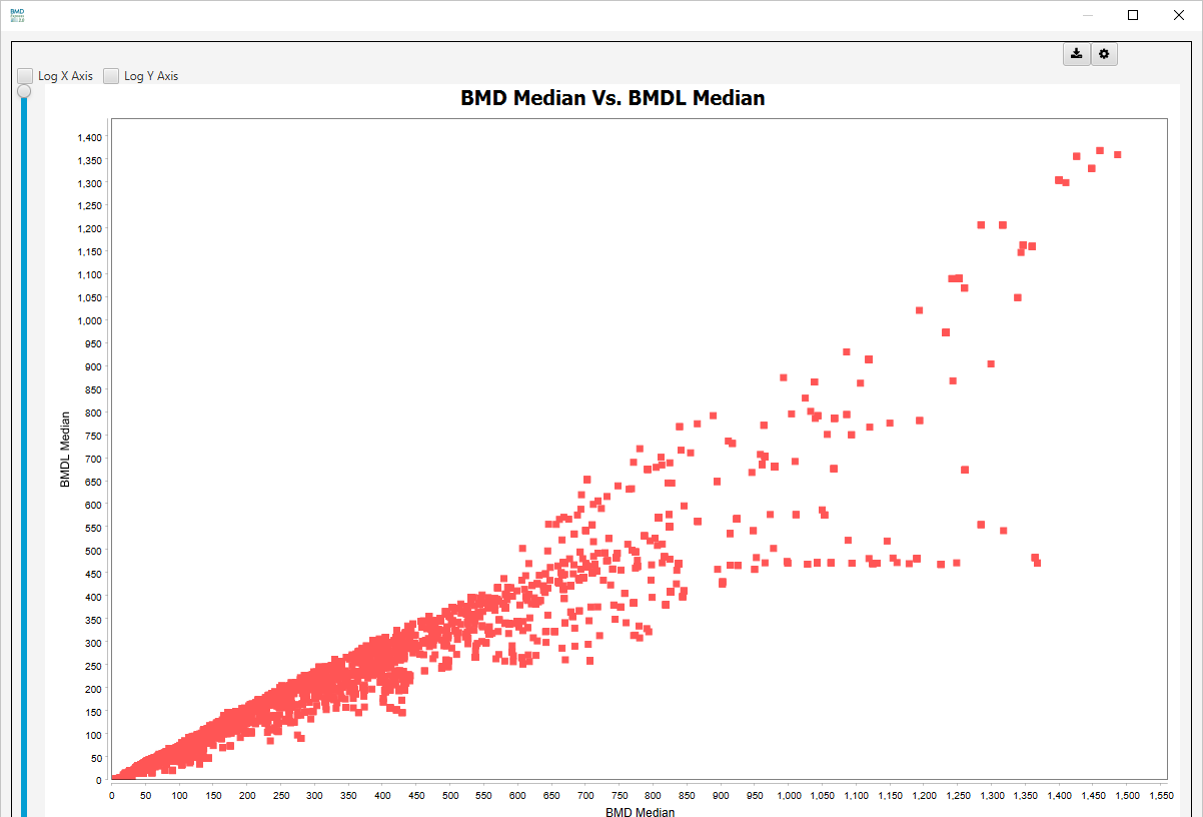
- BMD Median Vs. BMDL Median
- BMD Mean Vs. BMDL Mean
- BMDU Mean Vs. BMD Mean
These parameters are changed via the filter panel. You must also make sure that the Apply Filter box is checked in the toggles panel for these filters to be applied. The filters will be applied as soon as they are entered; there is no need to click any apply button other than the checkbox. The filters correspond to the columns in the Functional Classification data table that is selected and filtering corresponds to values in these columns when values are entered into the boxes. Some of the commons ones that are used include Percentage (percentage that a gene set is populated by genes that pass all filters), Genes that pass all filters (number of genes that pass all filters in gene set) and Fischer Exact Two Tail (measure of statistical enrichment of the gene set).