Statistical and Fold Change Prefiltering
Video tutorial demonstrating how to setup statistical filtering
The number of probes contained within a given genomics platform is typically on the order of tens of thousands. By selecting only probes with a statistically significant dose response, the computation required to complete the subsequent analysis steps is minimized. ANOVA, Williams trend [4], ORIOGEN (Order Restricted Inference for Ordered Gene Expression) [5], and fold change filters can be used to remove probes with small or statistically insignificant dose dependent expression changes. Note: The user can model all probes that are loaded without filtering beforehand. We recommend filtering to reduce noise and modeling run time.
The ANOVA test is a test of the null hypothesis that the responses at the different doses are all the same. The alternative hypothesis for ANOVA is that the responses are not all the same, with no restriction on the direction of change of the responses.
The two-sided William’s trend test compares a null hypothesis of no dose response with an alternative hypothesis of monotonically increasing or monotonically decreasing response (i.e., a response that either never decreases with increasing dose, or never decreases with increasing dose, with at least one change in response with increasing dose). An isotonic regression (nonparametric regression that fits a monotonic response to the data) is used to obtain estimates of dose specific response and resulting test statistics.
ORIOGEN is a non-parametric procedure that simultaneously identifies significant genes, and groups them according to patterns of inequalities. The implementation of ORIOGEN implemented in BMDExpress 2 computes the overall significance p-value for a gene by testing a null hypothesis of no dose response, against the union of alternate dose response profiles (such as monotone, umbrella shaped etc.). Adaptive bootstrap techniques are employed during significance p-value computation, and multiple correction stages thereby minimizing compute time.
After choosing a data set(s) from the Data Tree, select 'One-way ANOVA', 'Williams Trend', or 'ORIOGEN' from the 'Tools' menu. Fill in the parameters, and click, 'Start'.

Video tutorial describing data filtering setup in detail
- Note: you may need to enlarge the set box to see all setting options
- Expression Data: Choose data to be filtered.
- P-value Cutoff: A filter based on the p-value. Set to 0.05 by default; also includes 0.1 and 0.01 as default options, but you can enter any value.
- Multiple Testing Correction: False discovery rate correction applied to the selected p-value.[2]
- Filter Out Control Genes: Remove platform specific internal control genes (e.g. AFFX_xxxxx) from the analysis.
- Use Fold Change Filter: If this option is unchecked, all other options in this section will be disabled.
- Fold Change: A minimum fold change for inclusion in the BMD computation may be selected. Note: If data are loaded in linear form (i.e., "NONE" designation for transformation) the arithmetic mean of the dose groups is used to calculate the fold change values. If data are log transformed when loaded the geometric mean of the dose groups is used to determine fold change values.
- P-Value: Statistical threshold applied to the NOTEL/LOTEL test
- Fold Change Value: Threshold for NOTEL/LOTEL determination that is applied in combination with the p-value. Note: If data are loaded in linear form (i.e., "NONE" designation for transformation) the arithmetic mean of the dose groups is used to calculate the fold change values. If data are log transformed when loaded the geometric mean of the dose groups is used to determine fold change values.
- Dunnett's or T-Test: Both test are pairwise tests. The t-test option is a students t-test and the Dunnett's test is statistical test that takes into account multiple comparisons that are common in gene expression data.
- Number of Threads: Number of concurrent processes to assign.
- Progress Bar: Approximation of percent completion.

- Note: you may need to enlarge the set box to see all setting options
- Expression Data: Choose transcriptomic data set to be filtered.
- P-value Cutoff: A filter based on the p-value. Set to 0.05 by default; also includes 0.1 and 0.01 as default options, but you can enter any value.
- Number of Permutations: This is the number of randomized dose-response sets used in computation of the trend, and associated statistics.
- Multiple Testing Correction: False discovery rate correction applied to the selected p-value.[2]
- Filter Out Control Genes: Remove platform specific internal control genes (e.g. AFFX_xxxxx) from the analysis.
- Use Fold Change Filter: If this option is unchecked, all other options in this section will be disabled.
- Fold Change: A minimum fold change for inclusion in the BMD computation may be selected.
- P-Value: Statistical threshold applied to the NOTEL/LOTEL test
- Fold Change Value: Threshold for NOTEL/LOTEL determination that is applied in combination with the p-value
- Dunnett's or T-Test: Both test are pairwise tests. The t-test option is a students t-test and the Dunnett's test is statistical test that takes into account multiple comparisons that are common in gene expression data.
- Number of Threads: Number of concurrent processes to assign.
- Progress Bar: Approximation of percent completion.

- Note: you may need to enlarge the set box to see all setting options
- Expression Data: Choose transcriptomic data set to be filtered.
- P-Value Cutoff: A filter based on the p-value. Set to 0.05 by default; also includes 0.1 and 0.01 as default options, but you can enter any value.
- Number of Permutations: This is the number of randomized dose-response sets used in computation of the trend, and associated statistics.
- Number of Initial Bootstrap Samples: ORIOGEN uses an adaptive bootstrap p-value computation to maximize computational efficiency. This option sets the starting number of bootstrap samples used to compute the p-value for all the probes. ORIOGEN will start with this number of bootstrap samples and then gradually increase it, if necessary, until the number of samples reaches the maximum (set in the next option).
- Number of Maximum Bootstrap Samples: Maximum number of bootstrap samples used to compute the p-values for all the probes
- Shrinkage Adjustment Percentile: Used to control for false positives that can be identified when probes exhibit minimal variability. Default is set to 5.0, which reflects 5th percentile standard deviation of all probes in the data set. As the parameter decreases fewer probes are likely to pass the filter.
- Multiple Testing Correction: False discovery rate correction.[2]
- Filter Out Control Genes: Remove platform specific internal control genes (e.g. AFFX_xxxxx) from the analysis.
- P-Value: Statistical threshold applied to the NOTEL/LOTEL test
- Fold Change Value: Threshold for NOTEL/LOTEL determination that is applied in combination with the p-value
- Dunnett's or T-Test: Both test are pairwise tests. The t-test option is a students t-test and the Dunnett's test is statistical test that takes into account multiple comparisons that are common in gene expression data. Configure ORIOGEN and Fold Change options. Click 'Start'.
- Number of Threads: Number of concurrent processes to assign.
- Progress Bar: Approximation of percent completion.

Video tutorial describing data filtering results
Results are tabulated in the results table. Output consists of:
- Probe ID: Unique identifier for the probe/probe set in the row.
- Gene ID: List of genes included in unique probe/probe set.
- Gene Symbol: Gene symbols included in probe/probe set.
- Df1: Between dose group degrees of freedom (ANOVA only)
- Df2: Within dose group degrees of freedom (ANOVA only)
- F-Value: F-value from the one-way ANOVA. An F-value is defined as the variation between sample means / variation within the samples.
- Unadjusted P-Value: Nominal P-value from the test performed
- Adjusted P-Value: P-value following Benjamini-Hochberg correction
- Max Fold Change: Maximum value for all fold change dose levels.
- Max Fold Change Unsigned: Absolute value of the Maximum value for all fold change dose levels.
- Fold Change Dose Level 1, 2, etc…: Fold change for each dose level from control.
- Profile: Pattern of response observed in the data over the different dose groups. "U" indicates up-regulation, and "D" indicates down-regulation. Each dose is compared to the previous dose. For example if you run a 4 dose study including "0" dose the profile of UUD indicates that the probe trend increased for the first 2 positive dose levels and decreased at the 3rd (ORIOGEN only)
- NOTEL/LOTEL T-Test p-Value level n: (ORIOGEN and Williams only)
- NOTEL: No observed transcriptional effect level. Highest dose at which there was not an observed transcriptional effect for a transcript/gene.
- LOTEL: Lowest observed transcriptional effect level. Lowest dose at which there was an observed transcriptional change a the transcript/gene.

At the top of the main panel, there is a set of toggles that control various aspects of the prefilter analysis results view.
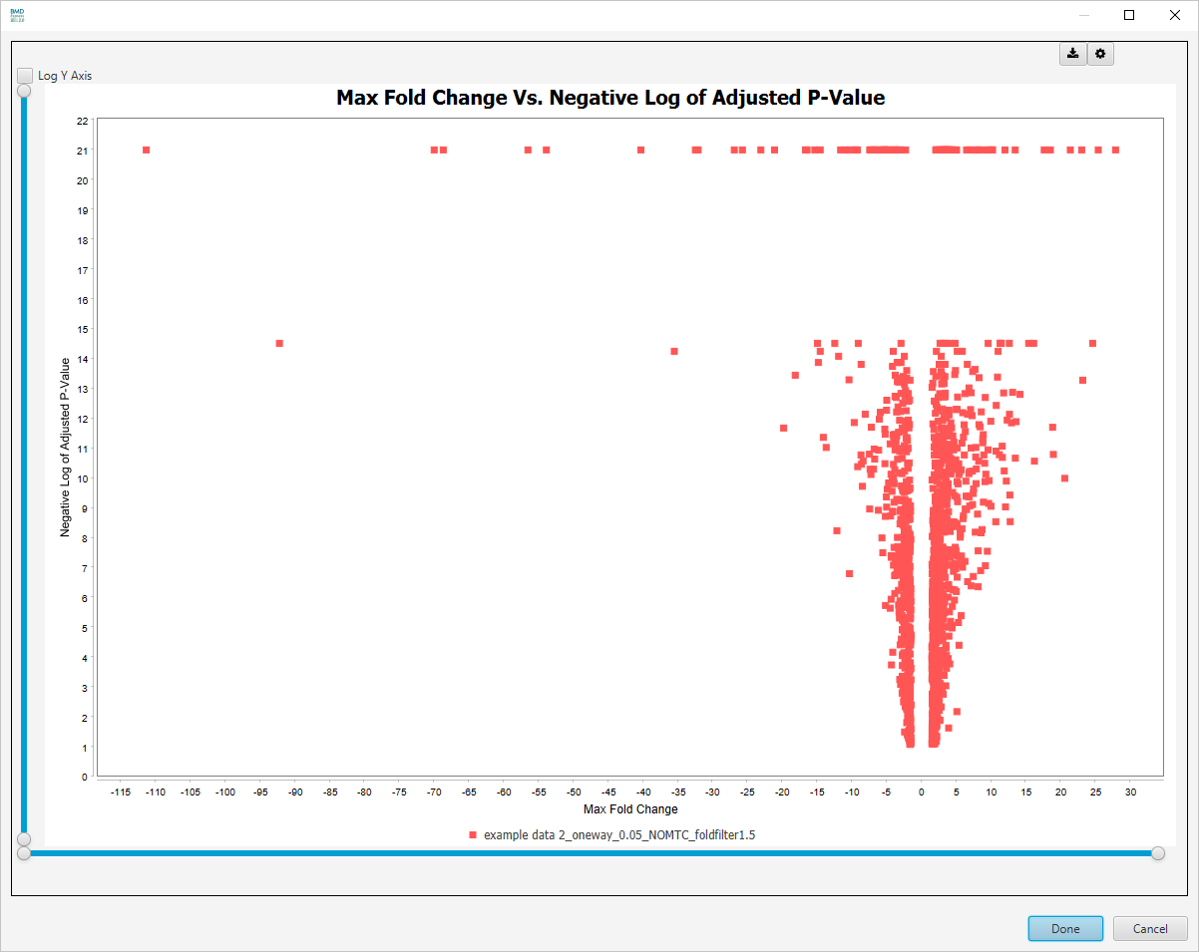
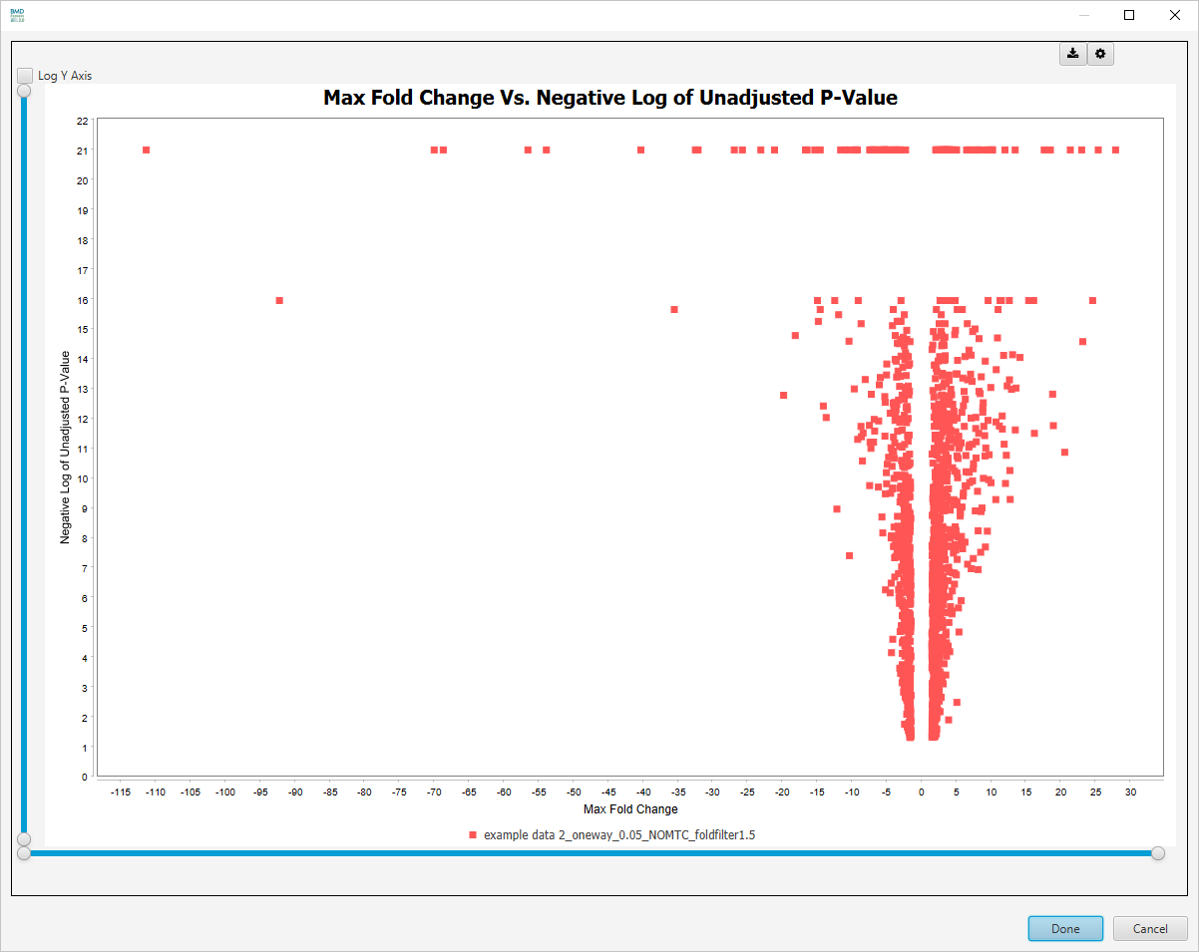
The default visualizations are:
-
Max Fold Change Vs. -log10 Adjusted P-value
-
Max Fold Change Vs. -log10 Unadjusted P-value
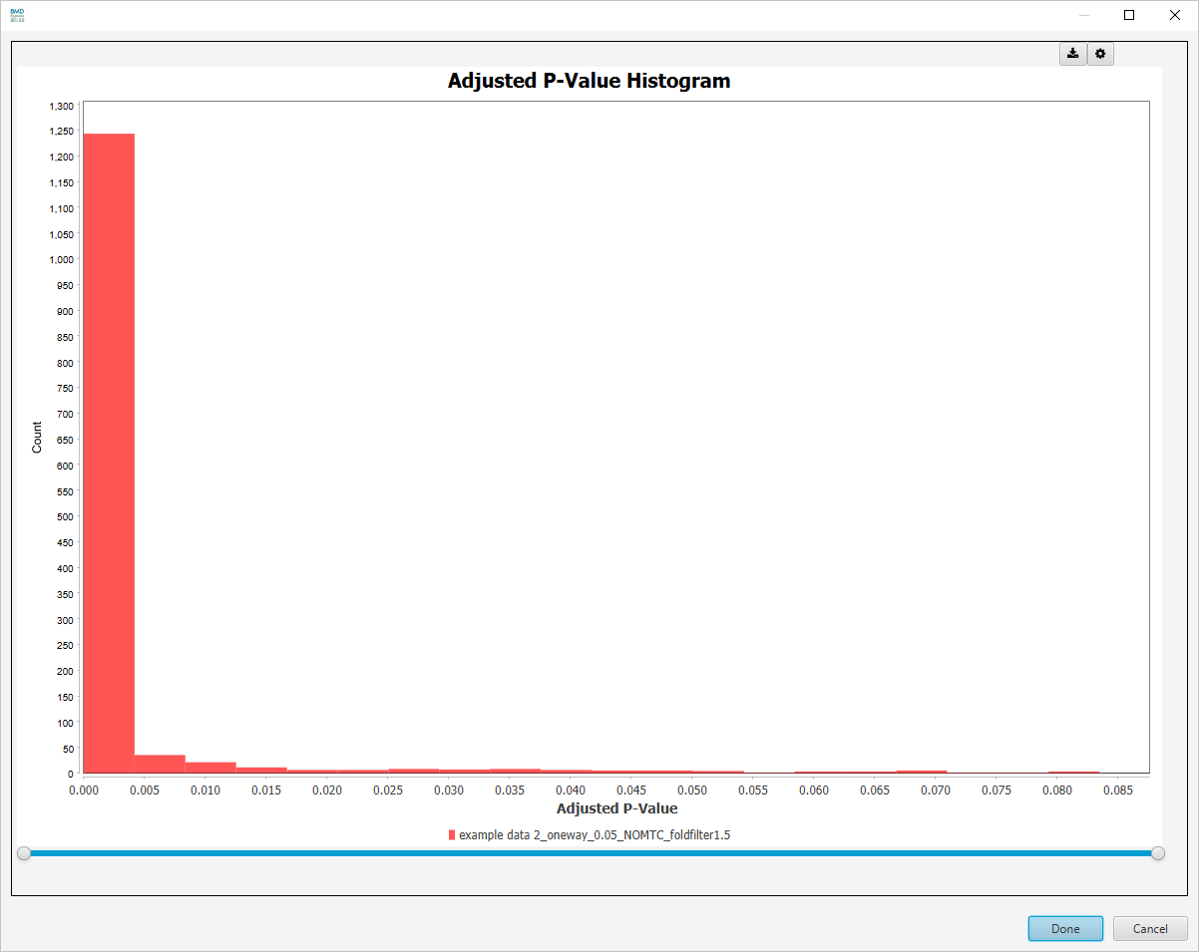
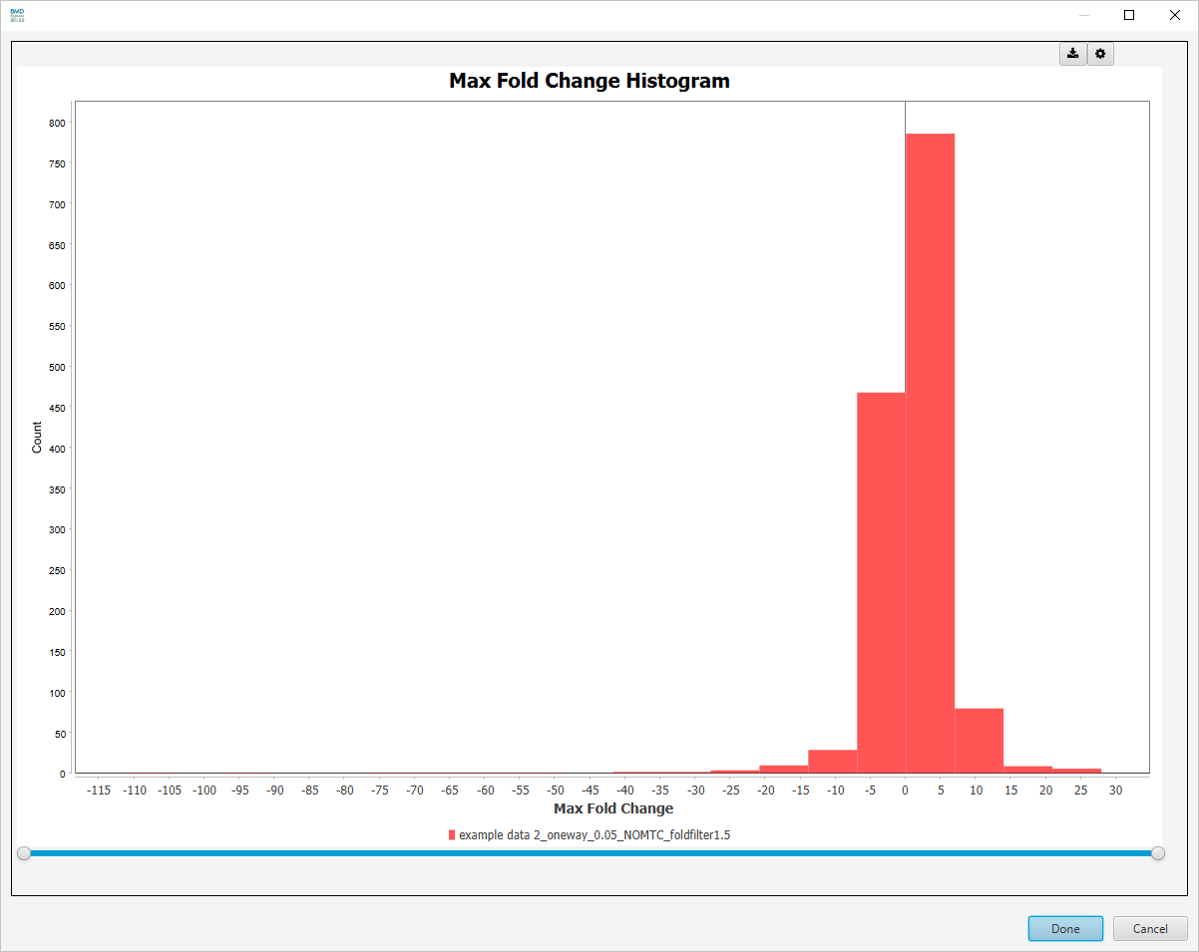
There are more visualizations available after clicking on Select Graph View dropdown list:
-
Unadjusted P-Value Histogram

-
Adjusted P-Value Histogram
-
Best Fold Change Histogram
-
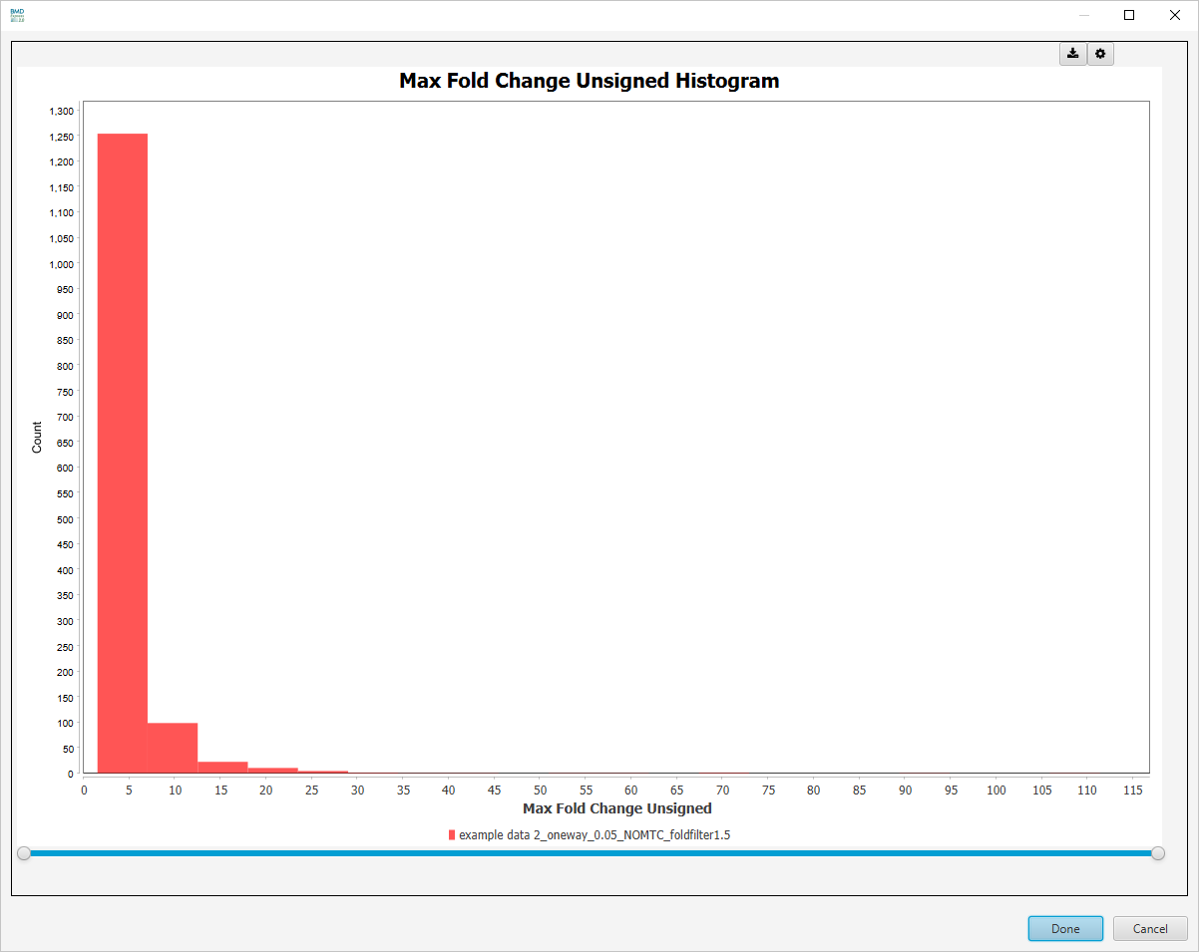
Best Fold Change (Unsigned) Histogram
-
Venn Diagram

These parameters are changed via the filter panel. You must also make sure that the Apply Filter box is checked in the toggles panel for these filters to be applied. The filters will be applied as soon as they are entered; there is no need to click any apply button other than the checkbox.