The goal in this assignment is to explore concepts of perception in a robotic system to accomplish a task. Given a mobile robot with a set of sensors in a partially known environment, objects/obstacles must be detected and counted. In addition, the robot must be started in a random position and not rely on any teleoperated commands.
The task to be solved here has been divided into several other tasks that together are the complete assignment resolution.
To be able to initialize the robot in a random position, the worlds_gazebo repository was built. When launching, one of the worlds will be randomly chosen as well as the position of the robot. The python-sdformat library is used to read the SDFormat XML file. Thus, the position of the cylinders is collected and a check is made to ensure that the robot never starts in a place already occupied by an obstacle.
Exploration is done using just a simple controller turtlebot3_explorer based on the turtlebot3_examples package. This ROS2 node subscribes to receive messages from the laser sensor and publishes velocity commands. If any obstacle is detected in front of the robot, it then rotates until it finds a free path again. Also has a service that allows to enable or disable this behavior.

The entire solution proposed here for counting obstacles is based on the use of an occupancy grid map. To generate this map, it was developed a ROS2 node turtlebot3_occupancy_grid that subscribes to receive messages from the laser sensor and updates the occupancy grid map for each message received. Initially, all points on the occupancy map have probability equal to 50%. As messages are received from the laser sensor, occupied points will have probability above 50% and free points on the map will have probability below 50%. This probabilistic occupancy grid is published at a fixed rate in the /custom_map topic.

The occupancy grid mapping algorithm uses the log-odds representation of occupancy:
where,
-
$m_i :$ grid cell$i$ -
$z_{i:t} :$ Collection of measurements up to time$t$ -
$x_{i:t} :$ Collection of robot's pose up to time$t$
Using this representation we can avoid numerical instabilities for probabilities near zero or one and compute the problem with less cost. The probabilities are easily recovered from the log-odds ratio:
The algorithm occupancy grid mapping below loops through all grid cells inverse_sensor_model implements the inverse measurement model

Detection obstacles/objects is done using the occupancy grid map by the node turtlebot3_object_detector, it subscribes to receive messages from the topic /custom_map. For each message received, the map is segmented with a threshold ensuring that only points with a probability greater than this threshold are 1. Then, OpenCV's connected components approach is used these determine occupied regions. Next, you can see how the result of a components connected algorithm in a binary image looks like.
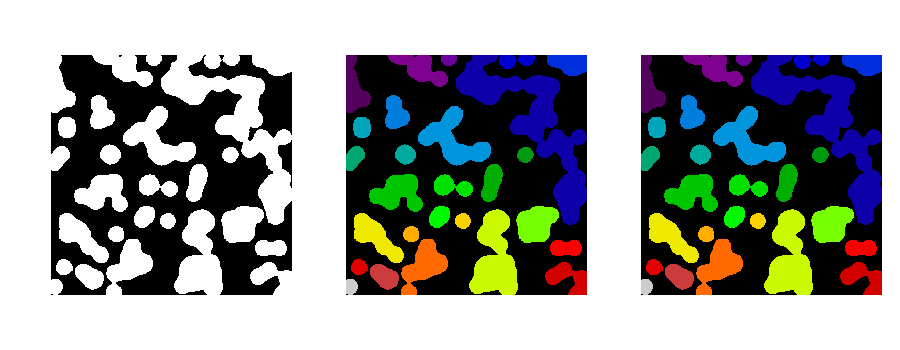
If this region's area is between a minimum and maximum value, then it publish the BoundingBox2DArray and an Image with everything rendered to visualize the results.

To determine when the exploration should stop, it is used the concept of fronteirs (intersection between unknown regions and free regions) in the occupancy grid map. So, the node turtlebot3_mission_controller subscribes to receive messages from topics /custom_map and /detections. It also makes available an action server, where through the goal sent to the action server, where a user can specify the number of remaining fronteir points, it will enable the turtlebot3_explorer to explore the enviromment until it reaches the specified numbers of frontiers points in the occupancy grid. Then, it returns the number of remaining fronteir points and the bounding boxes from turtlebot3_object_detector.

It is also available an action client node turtlebot3_mission_client responsible for sending the exploration task to the action server in turtlebot3_mission_controller and saving the results to a file.
Several worlds were made to test our solution. For the first tested world, we get the following results.

Then, for the second tested world,

Then, for the third tested world,

Finally, the last tested world,

The ROS2 nodes proposed here solved the problem with interesting results, as long as the obstacles are not connected or too close to the walls. Furthermore, it is not limited to resolving only in the turtlebot3_world world, any close enviromment should work fine.
Get this project,
git clone --recursive https://github.com/autonomous-robots/assignment-1.git
cd assignment-1/
You can build all packages needed to run this assignment with docker:
docker build -t assignment-1:latest -f etc/docker/Dockerfile .Not really safe, but it works.
sudo xhost +local:rootThen, create a network to run all containers in it:
docker network create my-netThen, open a terminal in the container with support for the QT application:
docker run -it -e DISPLAY=$DISPLAY -v /tmp/.X11-unix:/tmp/.X11-unix:rw --device /dev/dri/ --net=my-net assignment-1:latest /bin/bashThe first thing you'll need to do is run the gazebo inside the container:
gazeboWe haven't figured out why yet, but the first launch of the gazebo inside the container takes a long time. After the gazebo has opened the first time, you can close it and run our launch.
ros2 launch turtlebot3_mapper turtlebot3_mapper_launch.pyIf you want to explore the environment, just open a new container in the same network and run the action client node.
docker run -it --net=my-net assignment-1:latest /bin/bash
ros2 run turtlebot3_mapper turtlebot3_mission_client -f 200
After the task is finished, you can view the results in the generated results.txt file.
-
THRUN, Sebastian; BURGARD, Wolfren; FOX, Dieter. Probabilistic Robotics. MIT Press, 2005. p. 221-243.
-
SAKAI, Atsushi. Python Robotics, Python sample codes for robotics algorithms. https://github.com/AtsushiSakai/PythonRobotics
-
ROBOTIS. ROS packages for Turtlebot3. https://github.com/ROBOTIS-GIT/turtlebot3.
-
ROBOTIS. Simulations for Turtlebot3. https://github.com/ROBOTIS-GIT/turtlebot3_simulations.
-
ROS PLANNING. ROS2 Navigation Framework and System. https://github.com/ros-planning/navigation2