OSD task stalling #11333
Comments
|
I've left a MATEKF722SE running overnight and the OSD is still running. Looks like this may be painful to reproduce. |
|
yeah. :( When it happens again I can try and get more details from the running system. Can you think of anything that would be useful to look at? |
|
It happened again:
rx task for reference values: 0xFFFFFFFF (uS) / 1000 / 1000 / 60 = 71.582 minutes, I expect there's a rollover issue. The new OSD code needs to be further reviewed to find out how/where this is happening. |


|
@SteveCEvans Did you test with |
|
It seems quite consistent here, I set a stopwatch for 70 minutes, monitored it, and at 71 minutes it stalled again. 0xffffffff = 4294967295 / 1000 / 1000 = 4294 seconds, and it died just before that according to the |
|
Still going strong with a fairly busy display.
Some stats at this point. I note that we've used most of the available groups. If we run out of groups then the last group would end up containing the remaining elements. This will result in a long group duration estimate. I'll raise a PR to increase this.
|


|
I'm testing with a |
|
I was getting the failure after just 71 minutes earlier today, the 4 hour test yesterday may have been 71 minutes too, except that I didn't check it till 4 hours after I booted it. I'm fairly sure there's nothing wrong with the OSD code itself, since I don't think the This can help explain why it doesn't always do it too, as it depends on the scheduler code. |
|
Yeah, pretty sure it's overflow related in the scheduler now, it just did it again around 12968 seconds which is a multiple of the rollover seconds (3x). |
|
Not happening here after 44147 seconds. OSD still updating. Can you reproduce this on another FC with a non-PixelOSD display? |
|
Still happening here, on a more recent build with some other PR's merged and fixed. https://github.com/spracing/betaflight/commits/bf-h7rf-wip-6 |
I've not tried, but as noted via slack it should be possible to hard-code the osd states, osd group memberships and element durations in a test build or unit test for the scheduler to provoke the same behavior. I'm testing to see if the changes in #11354 help. |
|
I've been running the PR from #11354 and so far so good. |
|
This issue has been automatically marked as stale because it has not had recent activity. It will be closed if no further activity occurs within a week. |
|
Requires re-verification in light of recent changes to As I understand it the root cause has not been found yet and since the code is isolated to the OSD task and that code hasn't changed the finger is being pointed at recent scheduler changes as being the cause. |
|
Blocked, waiting on the CPU load issue identified on #11380 (comment) to be fixed first before retesting. |
|
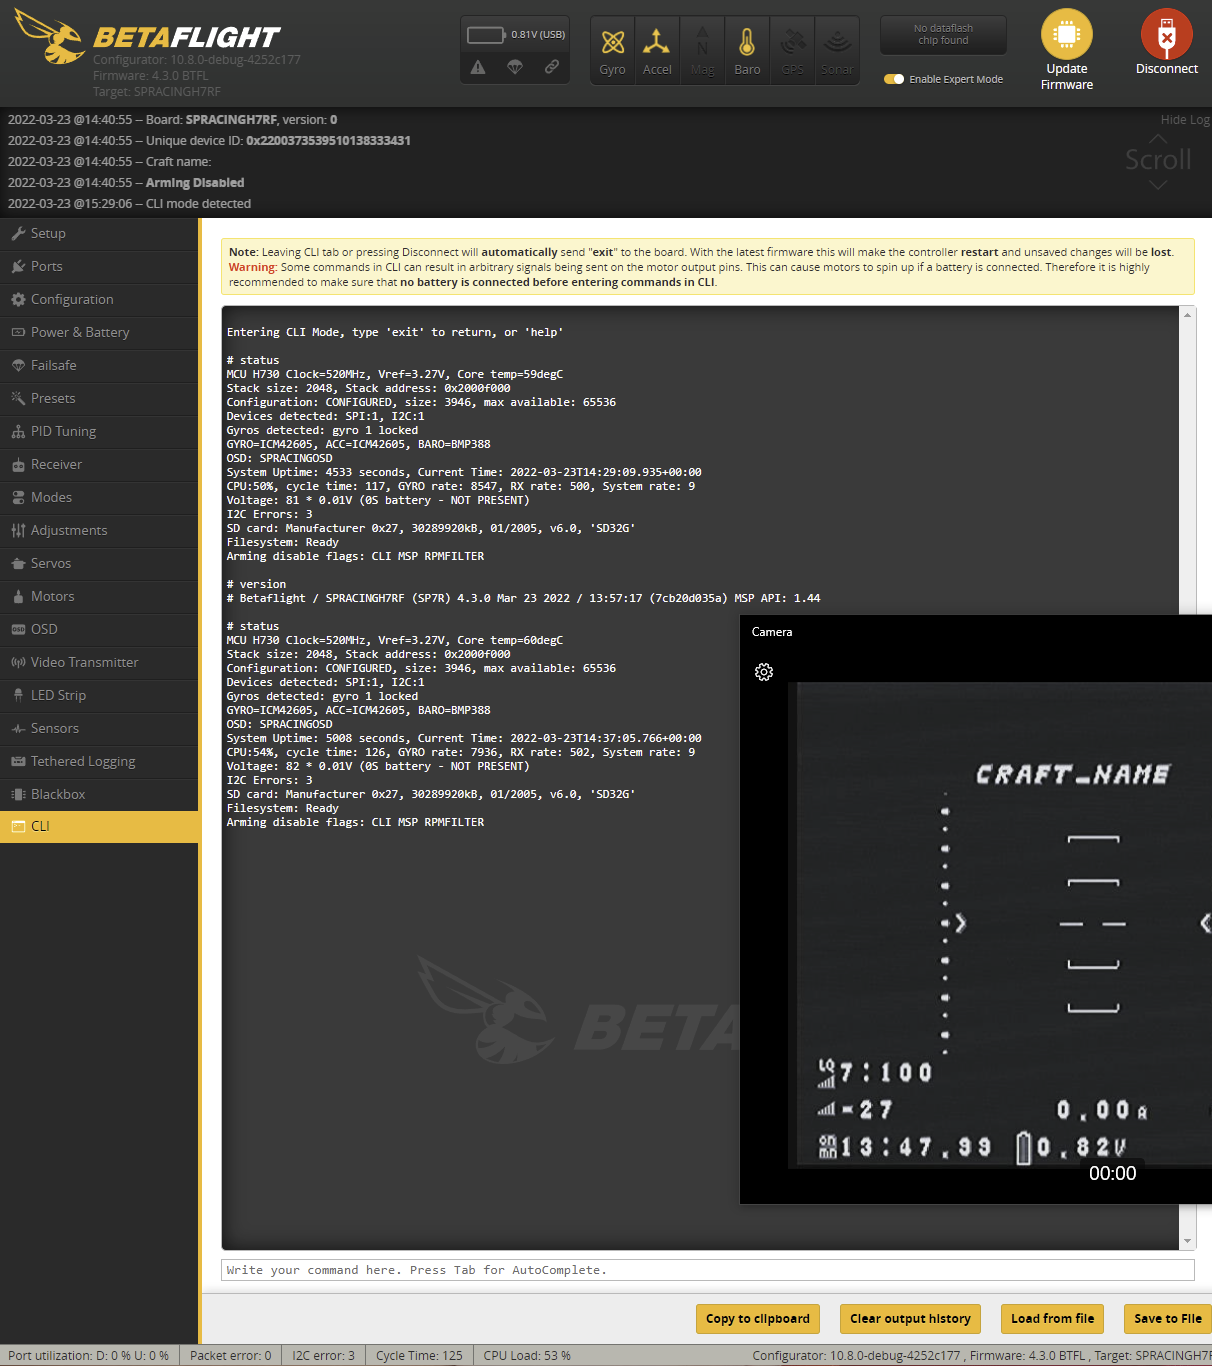
This re-occurred today while testing #11483
Binaries and code for testing here: #11483 (comment) USB still functional. Note the uptime below (4533 seconds = 75 minutes) vs the current OSD output On Time value (45 minutes). |

|
And even more weirdly, without rebooting the FC the OSD magically resumed by itself:
Further indicating a scheduling / roll-over bug in the scheduler. Likely as some comparison resulted in |

|
Please test with latest firmware on non-PixelOSD display hardware |
|
For those following, the fix is likely this: For now I'm testing on hardware which is more likely to be affected by the issue that was fixed due to the clock-speed of the system, which on the H7RF is 520Mhz. |
|
The bug in the scheduler, (fixed via #11459 (review)) appears to be the cause, I've not seen the task stall after about 12 hours of monitoring today. I will continue to monitor it and will update this issue after I'm satisfied it's no-longer occurring. |
|
Typical! Just a few minutes after writing my last comment I see it's stalled again... Still something causing the issue! Uptime: 11301 While it's frozen you can see the 'run' count for the OSD is '0'. @SteveCEvans Can you remind me what you suggested checking in the debugger again? I can't find your comment. |
|
The uptime is now: 14456 and the task has resumed by itself again. @SteveCEvans Given that the scheduler eventually resumes the osd task, under what conditions would you expect a high anticipatedExecutionTime, which will never change due to the task not running, to cause the scheduler to resume the task? |
|
This issue has been automatically marked as stale because it has not had recent activity. It will be closed if no further activity occurs within a week. |
|
This is still happening. |
|
This issue has been automatically marked as stale because it has not had recent activity. It will be closed if no further activity occurs within a week. |
|
Still occuring on a branch based of @SteveCEvans Note that the OSD task |
|
This issue has been automatically marked as stale because it has not had recent activity. It will be closed if no further activity occurs within a week. |
|
@haslinghuis can you mark this as BUG so the bot doesn't keep marking it as stale? |
|
@hydra What state is the OSD task in when it hangs, and what are it’s predicted state durations? |
|
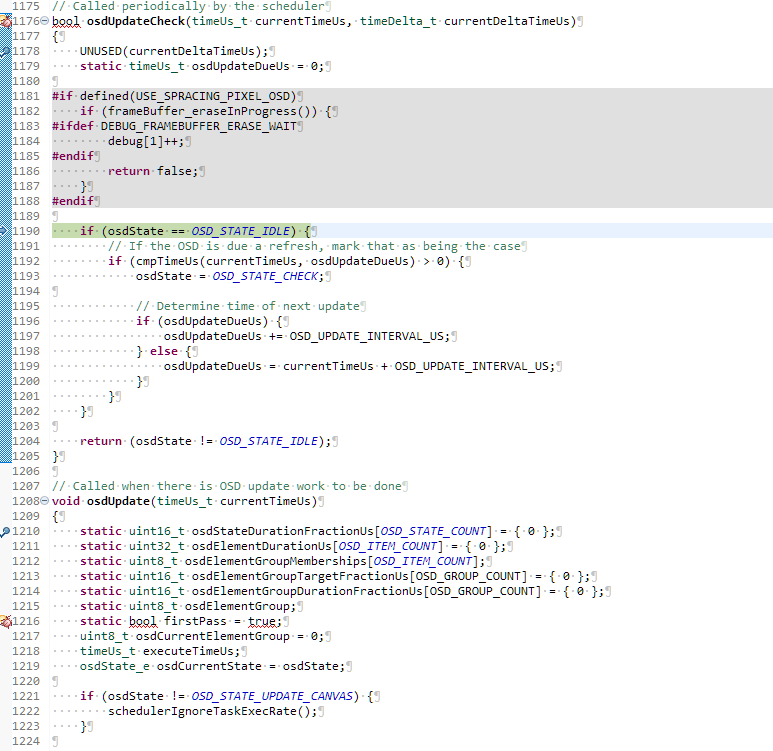
The state is always the 'idle' state when it hangs, this one: https://github.com/betaflight/betaflight/blob/master/src/main/osd/osd.c#L1156-L1176 It never actually runs the osd main loop. https://github.com/betaflight/betaflight/blob/master/src/main/osd/osd.c#L1179 And at some point the scheduler decides to schedule the task again and it unfreezes the osd task until it happens again. I'll hook a debugger up now and see if I can catch it and get the predicted state durations. Since it does it infrequently it might take a while to get some numbers for you, but you should be able to assume either, a) very small, b) normal, c) very big and then perhaps look into adjusting the scheduler so it doesn't block the task when either a,b or c occurs. finding out /why/ a,b or c occurs is a secondary problem. |
|
Here's a dump of the scheduler's view of the OSD task, the OSD task state is, as always, IDLE, as confirmed by the code-path taken on the disassembly below.
The scheduler is only running the task check function, and not the task itself. So I can't see the state durations as they're Here you can see the disassembly and registers of the |

Please enter the commit message for your changes. Lines starting
|
I made a branch based off 4.3.1-maintenance for the H7RF and included the temporary commit to expose the OSD state outside of the |
|
@SteveCEvans here you go:
|


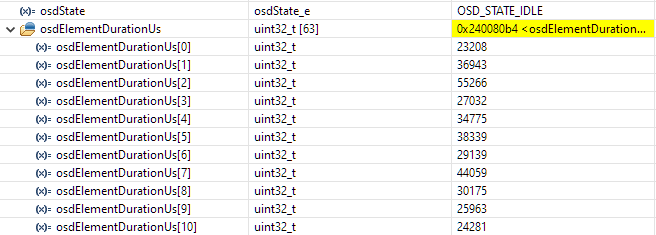
|
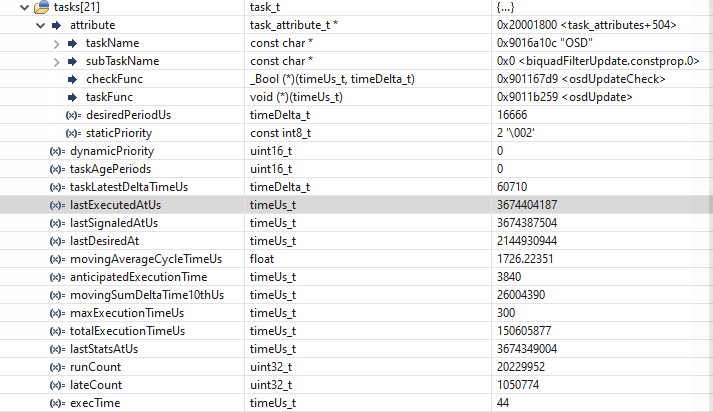
and here's the full tasks, as viewed by the scheduler: |
|
to catch what it looked like when the scheduler finally called
@SteveCEvans Do you have enough now to debug the scheduler? |


|
|
|
To me it feels like there's an overflow bug in the scheduler, look at the all the last-executed tasks when it last executed: Int max: 4294967295 / 0xFFFFFFFF, OSD The value of 'anticipatedExecutionTime' below, and in #11333 (comment) are the values when it's stalled / not happy. The values in #11333 (comment) are when the task finally resumed, i.e. scheduler ran the 'osdUpdateCheck' and the time comparison caused the state to change from IDLE to CHECK and then the scheduler eventually ran the osdUpdate method. Your comment is a bit unclear, what info do you still need, and under what condition? |
|
@SteveCEvans Hey, I know you're probably very busy but just wondering if you're able to make some time to look this is issue? |
|
I rebased the H7RF branch on Rebased branch is here: https://github.com/spracing/betaflight/commits/bf-h7rf-wip-28 |
Describe the bug
The OSD task stalls, no further updates are performed.
To Reproduce
Leave it running. I've encountered the failure encountered multiple times after a long uptime. since there's no place you can place a breakpoint the exact time it fails is currently unknown.
Expected behavior
OSD should never stall.
Flight controller configuration
Flight controller
SPRacingH7RF
Other components
N/A
How are the different components wired up
N/A
Add any other context about the problem that you think might be relevant here
The issue seems to be in this block:
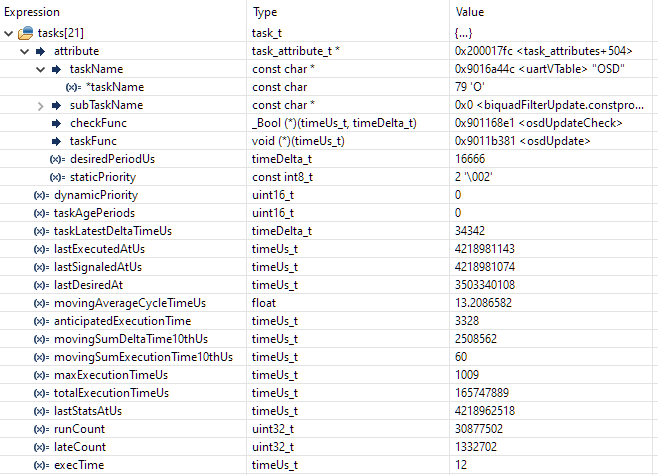
Here's the OSD task, after not being executed for a long time.
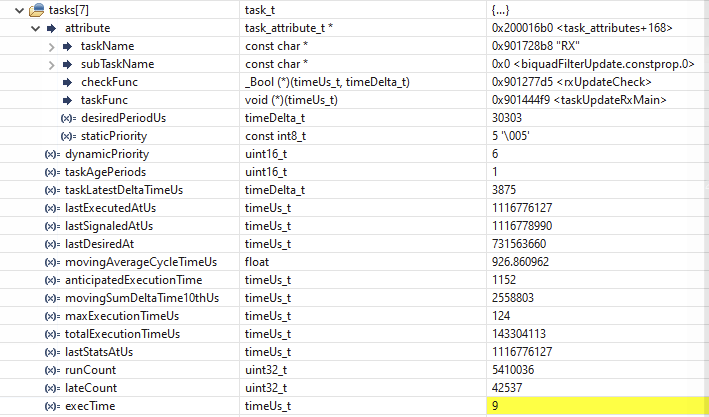
Compare the
lastExecutedAtUsabove to the one from the RX task, below.As you can see, the OSD task stalled, and hasn't been run for a long time.
After resetting the value of the register that contains
osdUpdateDueUsto 0 prior to it being checked the task resumed OK.After resuming the task I dropped to the cli and created the diff above and dumped the current status, as below:
That uptime is a 4hrs:09mins. the RX link was up all the time.
The text was updated successfully, but these errors were encountered: