When running scientific experiments, I often find myself in the situation of calling the same functions again and again - only with different arguments. The code for these repeated experiments and their visualization easily becomes cumbersome and highly redundant. That's where ExPlot is supposed to help.
ExPlot is a small Python tool that helps you plot your experiments with different combinations of input arguments. The idea is to automatically recognize which arguments are varied between experiments, run all the experiments parallelized over all the cores of your machine, and visualize the results with properly labeled axes and everything.
Let's assume we have some experiment, which is nothing more than a real-valued function with different parameters.
def my_experiment(x=0, f='sin', shift=False):
    # calculate some stuf
    # ...
    return result_value
Now, evaluating and plotting this function for different arguments works as simple as this:
import explot as ep

# plot function for all values of x in range(10)
ep.plot(my_experiment, x=range(10), f='sin')
ExPlot automatically recognizes that parameter x is the one to iterate over and produces the following plot:
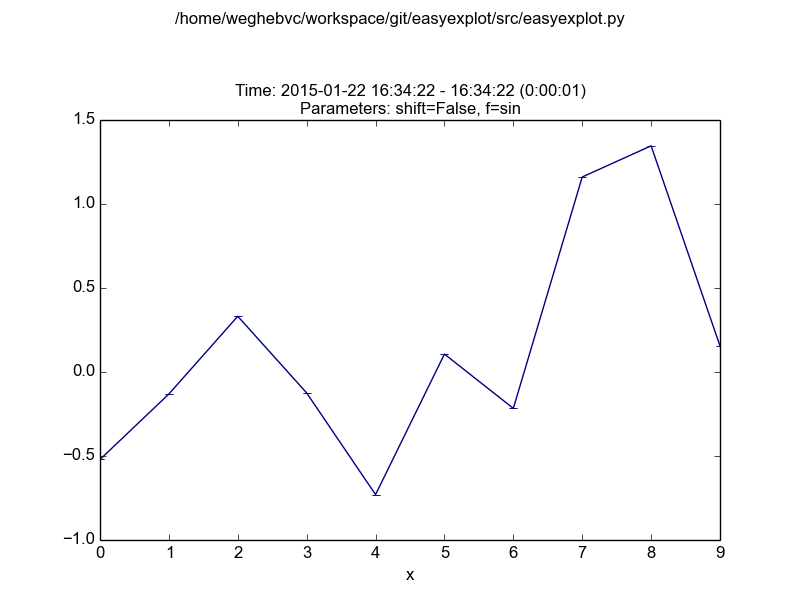
Note how all arguments are automatically included in the plot to make the comparison of different plots easier.
Suspecting that the function is noisy, we let ExPlot evaluate the function multiple times with the argument repetitions:
ep.plot(my_experiment, x=range(10), f='sin', repetitions=100)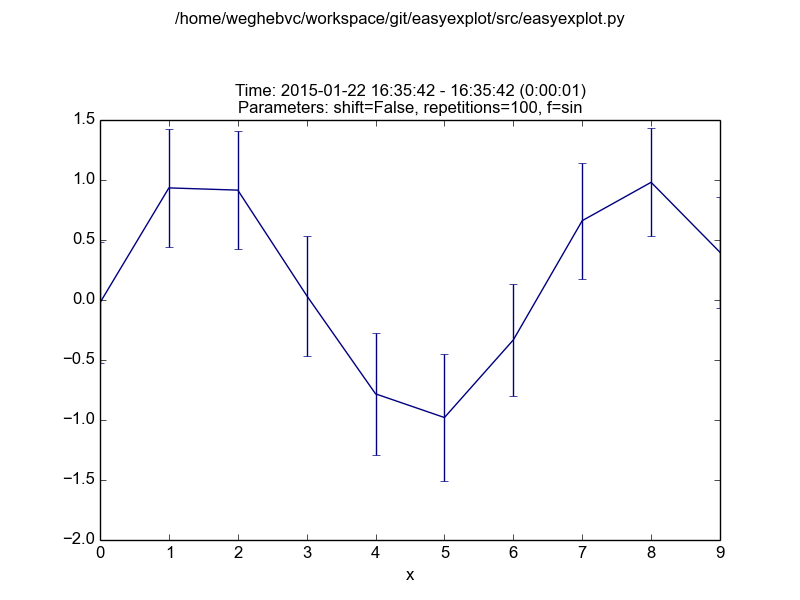
Nice, we have mean and standard deviation now! But how do the other parameters (f and shift) influence the result of the experiment? Again, we replace the arguments in question with lists of possible values and ExPlot takes care of running the experiment for different combinations of arguments.
ep.plot(my_experiment, x=range(10), f=['sin', 'cos'],
        shift=[False, True], repetitions=100)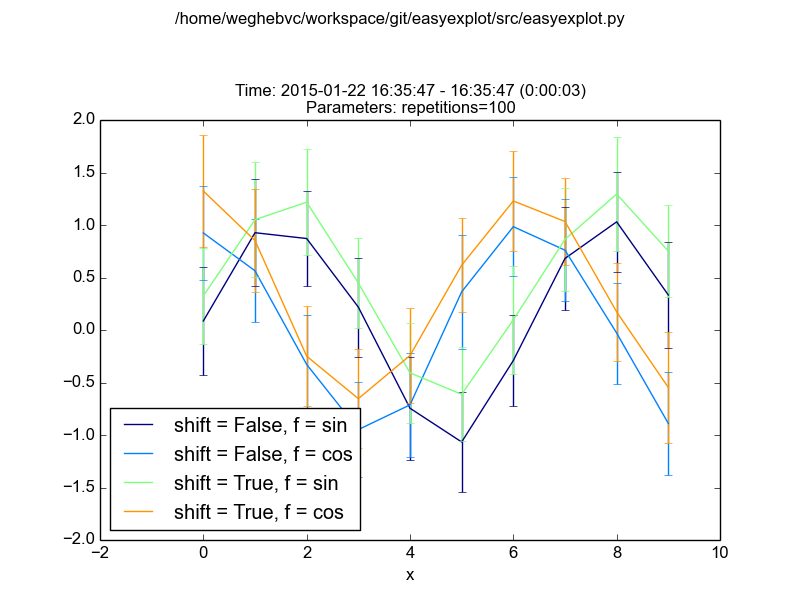
That was easy. But what if the result doesn't have varying numeric parameters like x? Then the result is plotted as bars:
ep.plot(my_experiment, f=['sin', 'cos'], shift=[False, True],
        repetitions=100)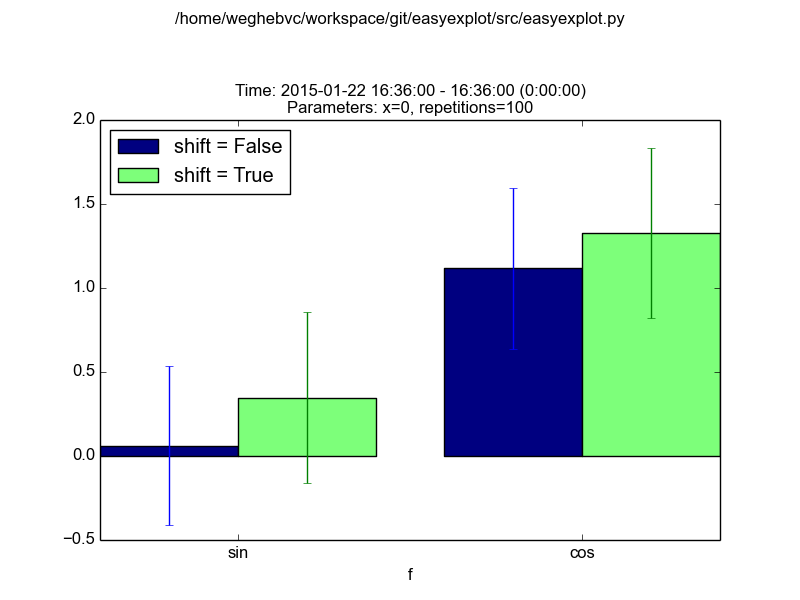
Enjoy!